


Want to know how your SEO efforts are paying off? Then, you’ll want to learn how to use Google Search Console (GSC).
Chances are, you already know what GSC is and that it offers detailed information about your site’s performance, security issues, errors, and more.
But did you also know it’s a powerful tool for increasing your site’s search traffic and it’s super helpful for finding data efficiently, and it’s got a couple of underused features?
Today, we’ll dive into some more specific use cases and how to get the most out of GSC. And, of course, we’ll also highlight its limitations, too.
Ready to learn more? Then let’s dive in!
Key Takeaways
- Google Search Console (GSC) offers a lot of detailed information about your site’s performance, security issues, errors, and more.
- GSC is a powerful tool for increasing your site’s search traffic and efficiently finding data.
- Two underused features of GSC include change of address and crawl stats, which you can find in Settings.
- Limitations of GSC include sampled data, only 16 months of data, and only 1000 rows of data.
- You can use Google Search Console to improve organic visibility, monitor search performance, and see what pages Google is indexing.
What Is Google Search Console and How Is It Used?
Google Search Console is a suite of tools from Google that helps you track your site’s performance, find issues, and help your site rank higher in Google. It is a powerful but complex tool.
I consider Google Search Console a must-have tool for any site owner, but it’s often overlooked. That’s a shame because, when used correctly, GSC can deliver amazing results.
Here are just a few of the benefits of using GSC:
- Ensure Google can access your site’s content
- Submit new URLs for crawling
- Monitor search performance and Core Web Vitals
- Monitor and resolve spam issues
- Discover how Google sees your site and analyze metrics
- Continually monitor for issues that might affect your search engine rankings
- Improve your traffic levels and organic visibility
- Handle technical issues and see which pages Google is indexing
It also has some underused benefits. For instance, you can change your domain address by going to settings.
As Rob Tindula, SEO Director at NP Digital, explains:
“When you do a migration or change a website’s domain, this tool allows you to alert Google of the change which helps with indexation of the new domain and the falling off of the old domain”.
It’s one of the most comprehensive free SEO tools out there. In fact, it rivals many paid tools on the market. It’s not a replacement for all of them, but it’s an outstanding supplement you can use alongside other tools.
How To Set Up Google Search Console
If you haven’t already, the first thing you will need to do is set up your website with Google Search Console.
Setting it up is simple.
Go to the Search Console website and sign up using your Google Account details. Ideally, you’ll want to use the same account where you access Google Analytics 4.
Go to the blue “Start now” button, click it, and a dialogue box appears:
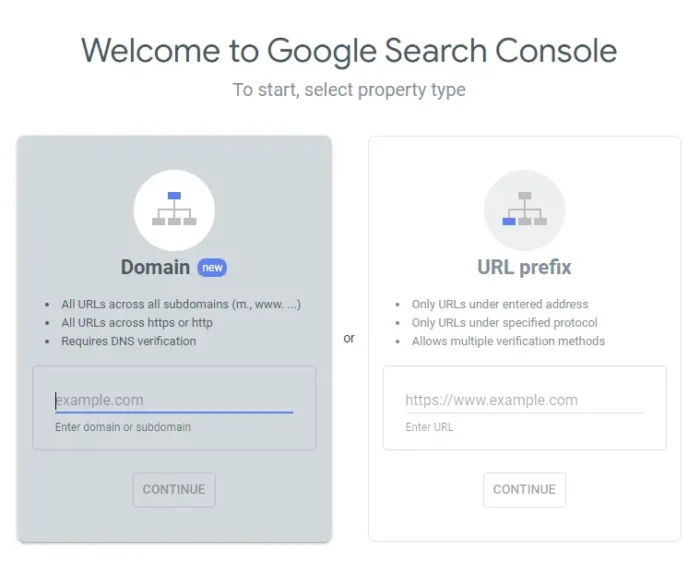
Select the URL prefix, as it gives you more options for verification.
Next, you will have to verify this site as yours.
Now, if you already have Google Analytics, it automatically verifies your site for you, and you will see this:
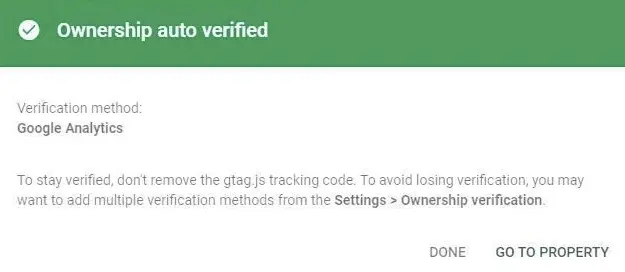
If this doesn’t work for you, use one of these other options for verification.
Once you’ve got your site verified, you will want to submit a sitemap. If you don’t already have a sitemap, you can create one using online tools like XML Sitemaps. WordPress users can install the Google XML Sitemaps plugin.
Owners, Users, and Permissions
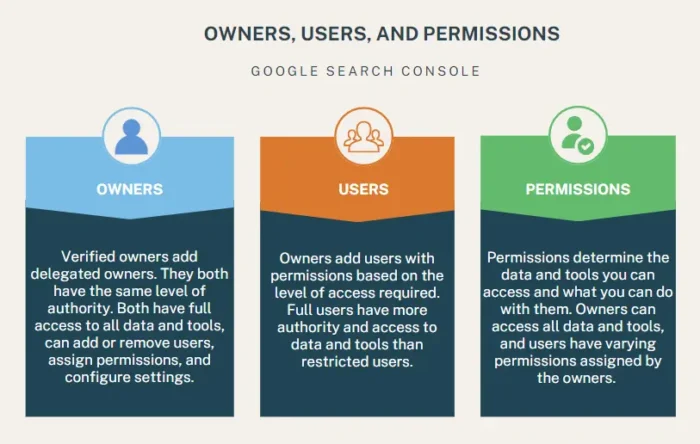
Not sure about the roles of owners, users, and permissions? Then let me explain.
Owners are in charge of Google Search Console. They have the power to add or remove users, access all the data and tools, and tweak settings.
Users: Owners can add users to Google Search Console and grant them full or limited permissions according to their role. Full users can access most data and take limited actions, while restricted users have limited access to data/tools.
Permissions: As the owner, you decide what actions users can take and what data they can access.
You can easily add delegated owners or users. Just head to Settings, find “Users and Permissions,” click on “Add user,” and set their permission levels. All users need a Google account.
What Data Can You Pull From Google Search Console?
Once you’ve added and verified your website, you’ll be able to see tons of information about your site’s performance in GSC.
Below, I’ll break down how to use Google Search Console and detail all of the data and reports you can pull from it.
Google Search Console Overview
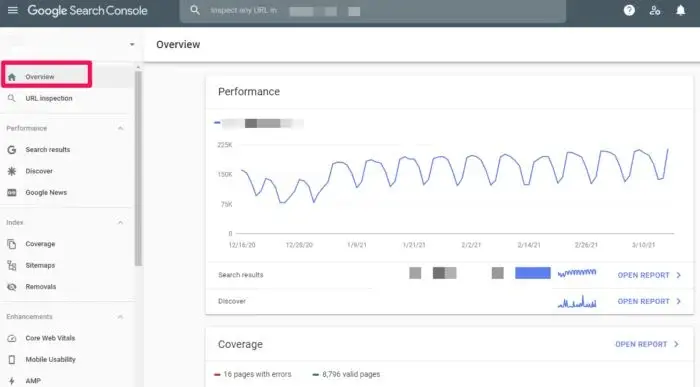
When you visit your website in GSC, you will first see your Overview.
This is an overview of the important data within Google Search Console. By clicking on the applicable links, you can visit specific areas, such as Crawl Errors, Performance Reports, and Sitemaps, from this screen.
You can also navigate to these areas using the menu in the left sidebar.
Performance Search Results
In the left sidebar, you’ll see Performance Search Results.
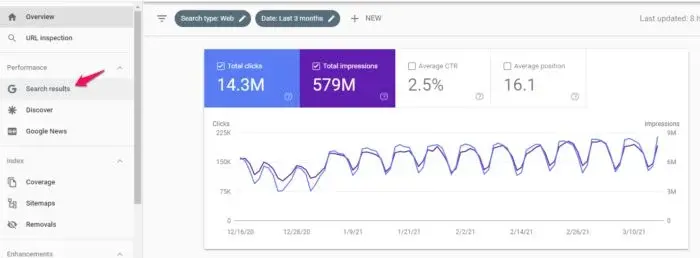
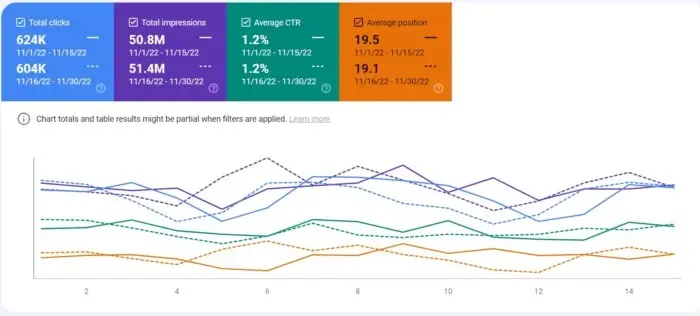
This section gives you an overview of how your site appears in Search Engine Results Pages, including total clicks, impressions, position, click-through rate, and what queries your site shows up for.
The filters at the top allow you to sort data based on location, date, type of search, and much more. This data is crucial to understanding the impact of your SEO efforts.
Here’s what each of them does:
- The Clicks filter shows you how many clicks you’ve gotten from the SERPs.
- The Impressions filter shows you how many SERP results people viewed. Google counts these impressions differently based on certain factors, but that’s really all you need to know.
- The CTR (click-through rate) is probably a metric you’re familiar with. Google has a standardized formula for this: the click count divided by the impression count.
- The Position filter gives you the average position of the topmost result of your site.
Together, these four filters give you a wide range of data.
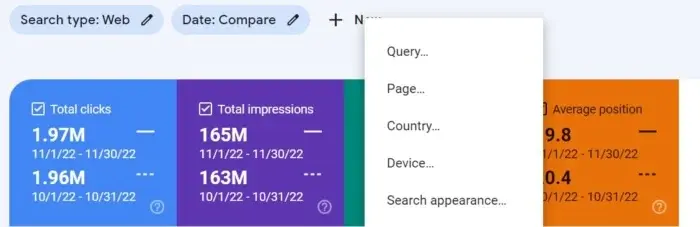
The options in the next box allow you to refine your results further. These are grouping options that categorize the data for you.
I’ll briefly go over each of them.
- The Queries option returns a list of search terms that drove users to your site.
- The Page option shows you which pages on your site appeared in search results.
- The Country option shows you where all of these searches came from.
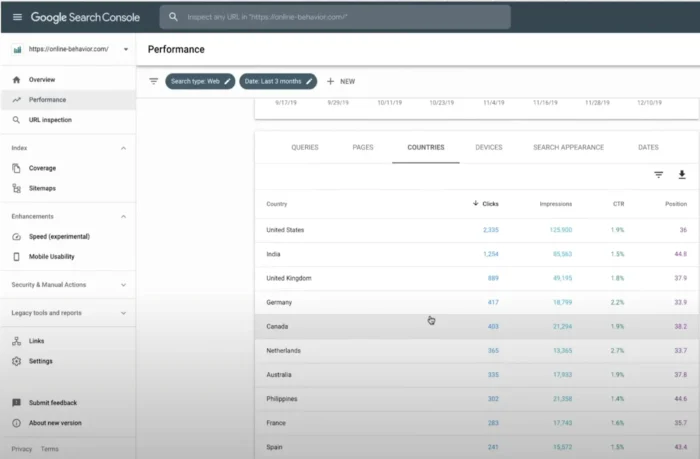
- The Device option shows you which devices were used to search.
- The Search Type option shows you if users used web search, video search, image search, or another type.
- The Search Appearance option lets you use special filters. You might not always see this option since it requires you to have impressions for at least one of the other features.
Finally, the Date option lets you choose the timeframe.
Index Coverage Report
This report gives you data about the URLs Google has tried to index on your selected property and any problems Google has had.
As Googlebot crawls the internet, it processes each page it comes across to compile an index of every word it sees on every page.
It also looks at content tags and attributes like your titles or alt texts.
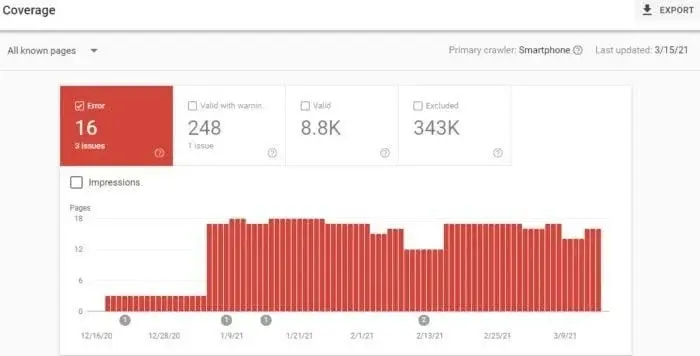
This graph shows a breakdown of the URLs on your site that Google has indexed and that can thus appear in search results.
As you add and remove pages, this graph will change.
Don’t worry too much if you have fewer indexed pages than you think you should. Googlebot filters out the URLs it sees as duplicate, non-canonical, or those with a noindex meta tag.
You’ll also notice a number of URLs your robots.txt file has disallowed from crawling.
And you can also check how many URLs you’ve removed with the Removal Tool. This will most likely always be a low value.
Sitemaps
A sitemap acts as a guide for your website. It shows all the URLs on your site and helps search engines understand your website’s structure and content. Once you’ve added a sitemap, Google search engines can crawl and index it more easily.
In GSC, under Sitemaps, you can add a new sitemap or find information about previously submitted sitemaps.
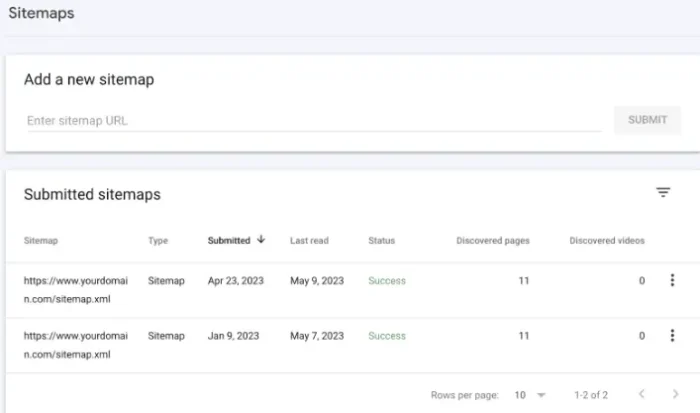
If you notice the last date your sitemap was downloaded is not recent, you might want to submit your sitemap to refresh the number of URLs submitted.
Otherwise, this helps you track how Google is reading your sitemap and whether all your pages are viewed as you want them to be.
Removals
If you need to temporarily block a page from Google’s search results for some reason, head to Removals.
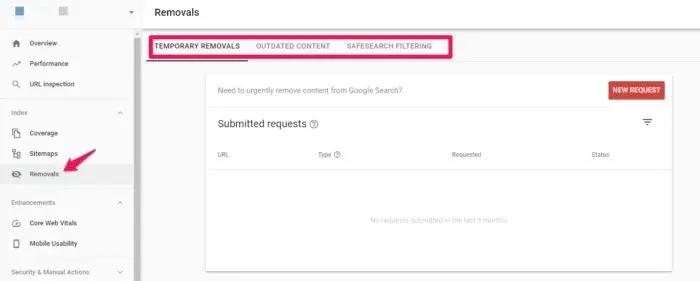
You can hide a page for approximately 90 days before this wears off.
If you want to remove a page from Google’s crawling permanently, you’ll have to do it on your actual website.
Core Web Vitals
Core Web Vitals are a set of metrics that impact your search ranking. They include speed, usability, and visual stability. These are now ranking signals, so you’ll want to pay attention to them.
Some of the key metrics that comprise Core Web Vitals include:
Largest Contentful Paint (LCP): This is the time that a page takes to load. A good score is 2.5 seconds or less. Note this includes large items like images or headers.
Cumulative Layout Shift (CLS): This measures a site’s visual stability, particularly how much the layout changes after it loads.
Interaction to Next Paint: This metric measures page responsiveness by using data from the Event Timing API. Basically, the lower your INP is, the more responsive your site is. A good score is below 200 milliseconds.
Links To Your Site
Curious about your backlinks?
GSC shows you the domains that link to you the most, as well as the pages on your website with the most links. Scroll down in the left sidebar until you see Links. Click, and you’ll see a full report of links to your site:
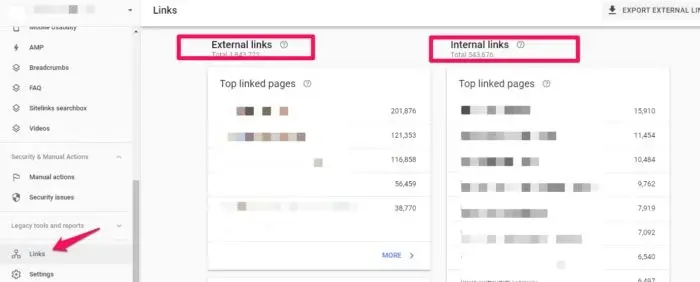
This is probably the most comprehensive listing of your backlinks (and internal links!) you will find, for free at least.
It’s a powerful tool for understanding where your content is being leveraged on the web and what performs best in Google’s eyes.
Manual Actions
The Manual Actions tab shows you if any of your pages do not comply with Google’s webmaster quality guidelines.
Recently, Google has taken action against scaled content abuse and domain abuse.
That means if your content is generated solely by AI, or if you’re creating articles just to game search engines (scaled content abuse), you might get a manual action.
The image below shows other examples of scaled content abuse:
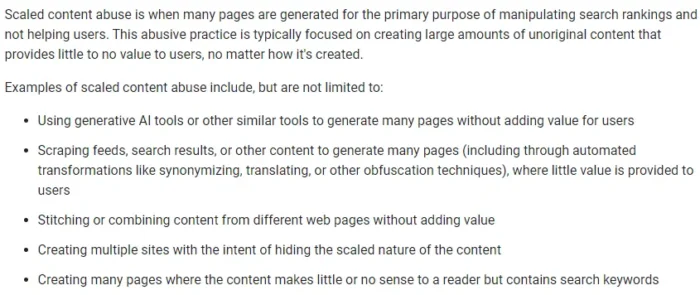
You could also land a manual action for domain abuse. This includes things like spam, defamatory content, or anything that’s inappropriate. Google has a domain abuse policy for users to follow, so ensure you stay on the right side of it.
Crawl Stats
For a more in-depth analysis of how often Googlebot is looking at your site, you can use the Crawl Stats report under Settings > Crawl stats.
As Rob TIndula, SEO Director, NP Digital, explains:
“This report shows how Google crawls your website, which can be helpful for technical SEO to find crawling and indexation issues. For example, Googlebot crawls a large percentage of URLs that result in errors or redirect status codes”.
Here, you’ll see how often Google crawls your site’s pages, downloaded kilobytes per day, and your site’s download times.
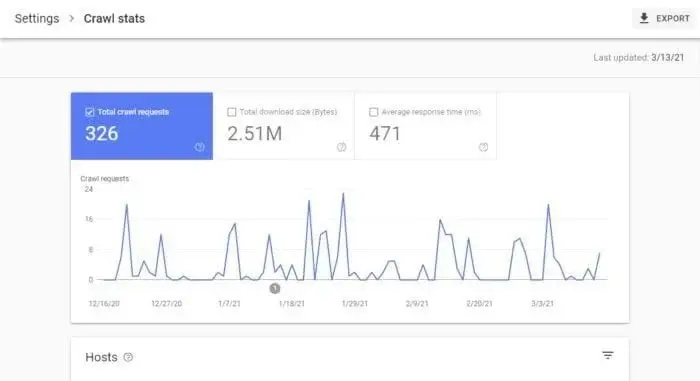
According to Google, there is no “good” crawl number, but they do have advice for any sudden spikes or drops in your crawl rates.
URL Inspection
This tool is helpful as it lets you do a test run of how Google crawls and renders a specific URL on your site.
It’s a simple way to make sure that Googlebot can access a page that you might otherwise leave to guesswork.
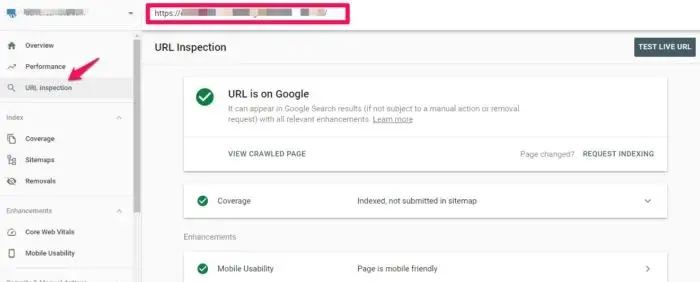
If you’re successful, the page renders, and you can see if Googlebot blocks any resources.
If you want access to your site’s code, click View Tested Page to see the HTML, a screenshot, and any crawl errors. (Note: Crawl errors used to be its own report; now, they’re located in URL inspection under Coverage.)
When you get to the debugging point of web development, you can’t beat this free tool.
Robots.txt Tester
If you’re using a robots.txt file to block Google’s crawlers from a specific resource, this tool allows you to double-check that everything is working.
For instance, if you have an image you don’t want to appear in a Google Image Search, you can test your robots.txt here to make sure that your image isn’t popping up where you don’t want it.
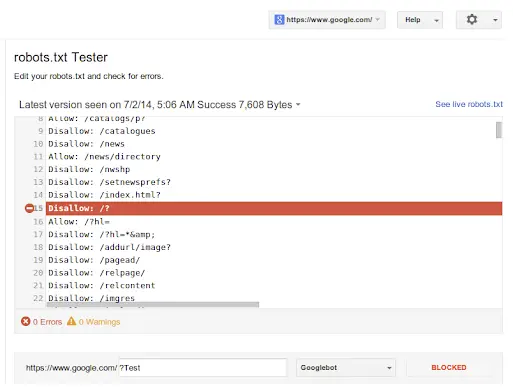
When you test, you’ll either receive an Accepted or Blocked message, and you can edit accordingly.
How to Use Google Search Console to Increase Your Traffic
You should be pretty well versed in how to use Google Search Console by now. But did you know you can leverage the Performance Search Results reports on the platform to drive more traffic to your website? Here’s how:
Optimize Results That Don’t Get Clicks
This is one of my favorite features of GSC.
The idea here is to look for keywords with lots of impressions but few clicks and a low CTR. Try to find 5-10 keywords that meet these criteria.
First, you have to run a simple report.
Start by clicking all four filters: Clicks, Impressions, CTR, and Position.

Next, select the Queries option.

Below the graph, you should see a list of keywords.
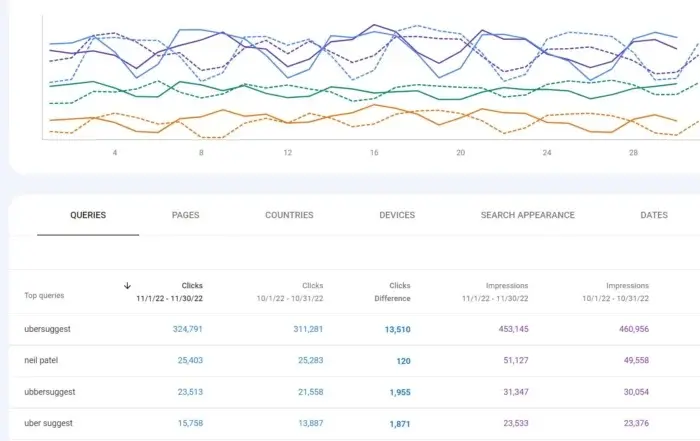
Those four filters you applied are available for each keyword:
This will give you a great idea of how each keyword is performing.
Next, run a search. Either open Google in a new tab or window, use an incognito window in Google Chrome, or change your IP address for broader results.
Search each keyword and look at the SERP result.
If a listing has low views, the most common causes are a bad title tag or a bad meta description.
Try:
Tweaking your title tags: This is the biggest and most obvious part of your result, so you need to make them SEO-friendly but also compelling.
Maximize your meta descriptions: After seeing the title tag, the meta description gives your readers essential details. Keep them short and clear, and make the reader curious.
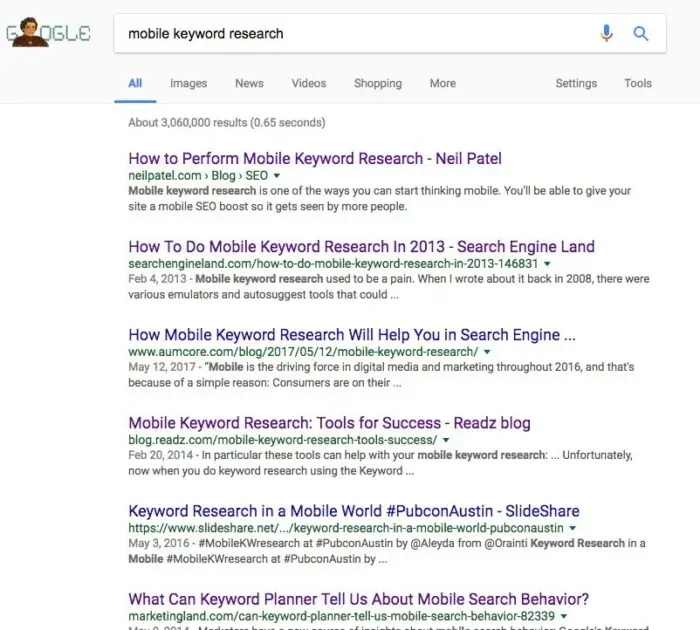
Find Your Mobile Keywords
If you’re serious about enhancing your SEO, I recommend putting some time into mobile keyword research.
Performance Search Results can show you which keywords mobile searchers are using.
To see this in action, look at the Devices option:

Above the graph, click “new” and choose “device.”
You should see options for Desktop, Mobile, or Tablet. Select Mobile.
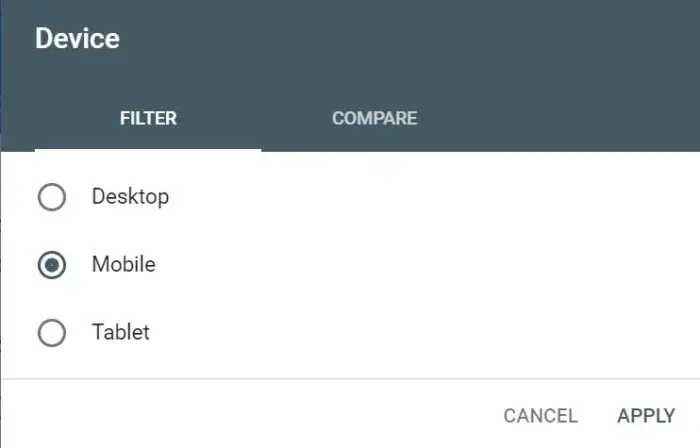
Now, you’ll see all of the keywords that mobile users are searching to find your site in the SERPs.
Once you know these keywords, you can implement them into your mobile SEO.
Find Performance Drops
Here’s something about Performance Search Results that’s not obvious: It’s got its limitations.
By default, a Performance Search Results report covers the last 3 months, and the furthest back in time Performance Search Results can go is 16 months.
This can hide some issues.
For example, if one of your keywords is at position 11, you’d probably think it’s doing well.
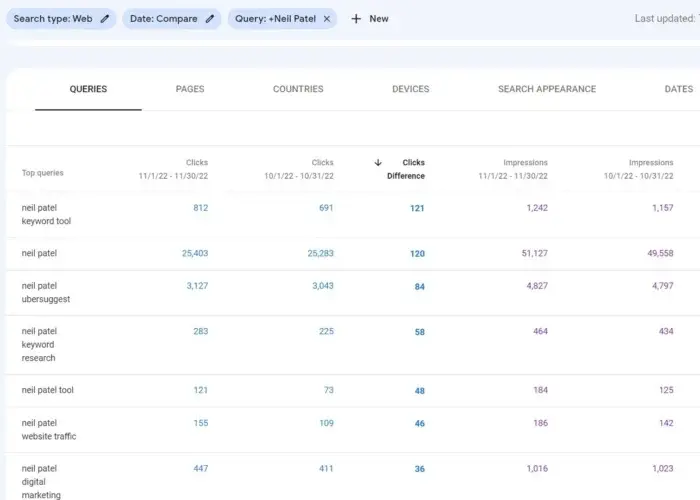
But that keyword could have been at position eight a few months ago. You can get around this, though, by adjusting dates.
Right now, you can see that it says “Last 3 months.”

You can take a look at older dates, but what I really like to do is compare date ranges. This is one of SA’s handiest tools.
Click on the “Last 3 Months” text. You’ll see a box pop up:
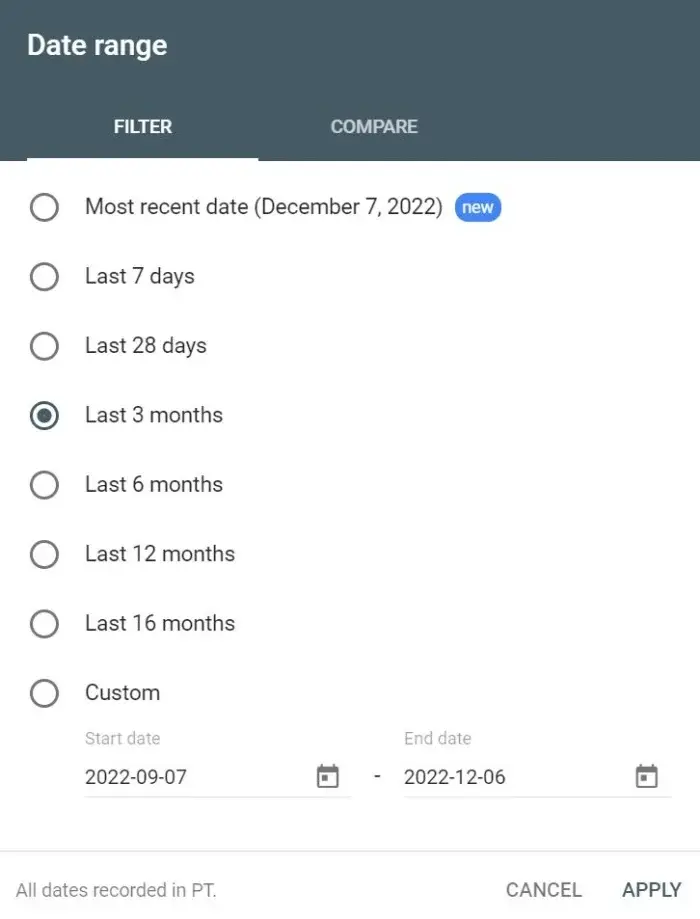
Click on “Compare.” Then you’ll see this:
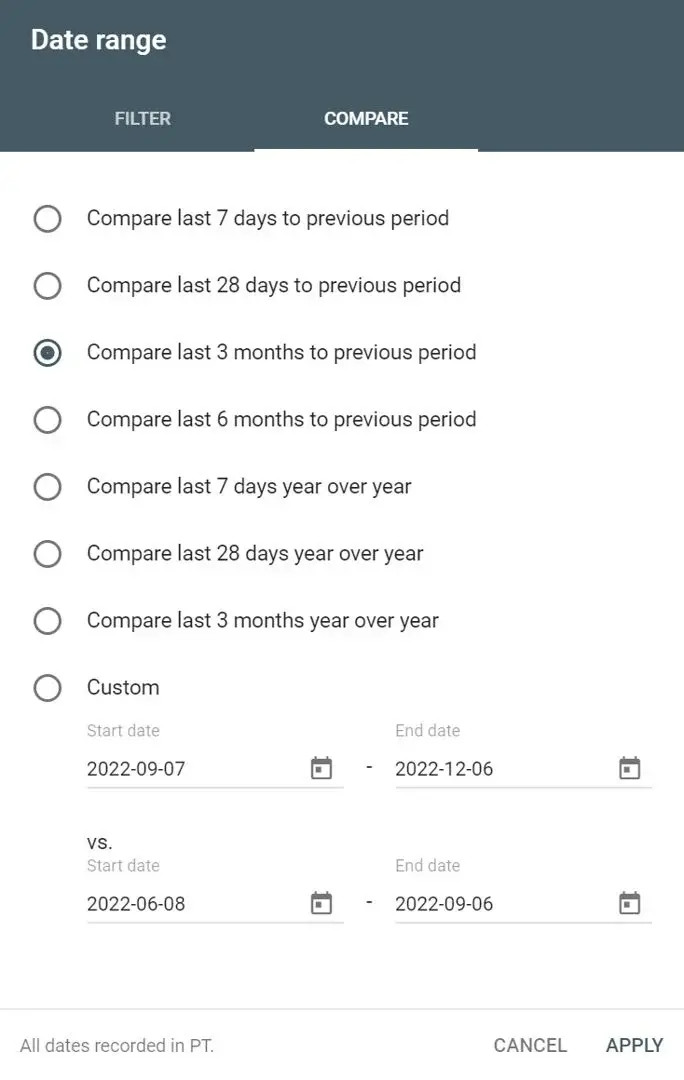
Rather than using one of the preset options, you can click the “Custom…” option to specify exact date ranges.
I like this option because it’s super flexible.
Once you’ve set your date range, you should see something like this:
In the first section, you can see how all of your metrics have changed, but here’s the really cool thing about the Dates feature.
When you change a date, you can change anything else you want, and the dates will stay the same.
You can use all of this information by running a Google search yourself and seeing if you’ve been pushed down a few positions.
If you have, you know you need to recover your ranking.
You can use the Dates function to find any sort of drop in performance. That way, you’ll know where to start fixing it.
Analyze Your Backlink Profile
In Google Search Console, you can check out who’s linking to your site.
Just head over to the Links section and you’ll see a list of external sites linking to yours and the pages on your site with the most links.
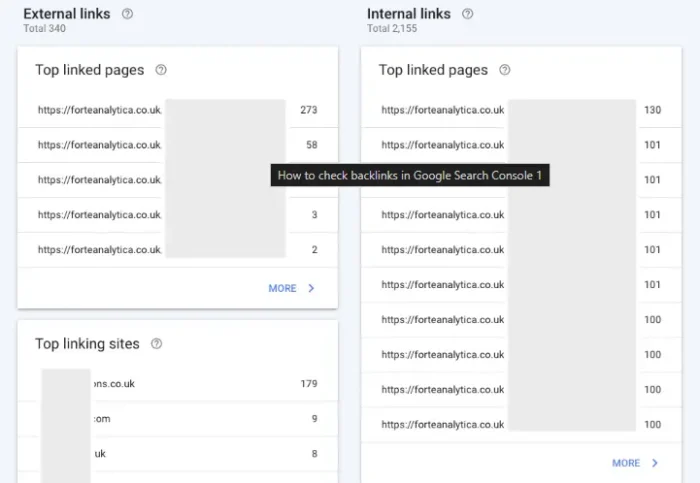
This info comes in handy for spotting link-building opportunities and tracking the quality and relevance of current links. Plus, you can use it to uncover spammy links and disavow them.
And there’s more! You can use the links report to see:
- Top linking sites
- Top linking text
- Backlinks for a specific site to a specific page
- Top linking sites for a given page
The backlink feature shows internal links, too, including:
- Top linked pages within your own site
- Which pages link to a given page
Check For Indexing Issues
Google’s Search Console page indexing report tells you which pages Google has crawled and indexed.
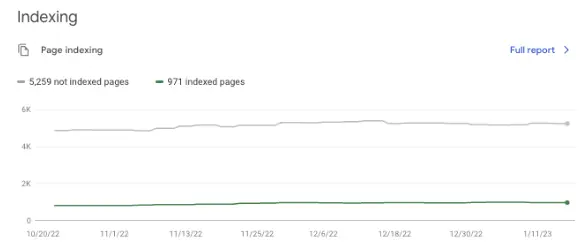
By going to the Summary page, you’ll see a list of indexed and non-indexed pages, along with tables detailing why Google couldn’t index a URL or other indexing improvement suggestions.
There may be a lot of data there, so focus on these three areas:
- The “Why pages aren’t indexed” table, to find details of issues that stopped a URL from getting indexed. You can use this information to decide whether you can fix the issue.
- The “Page experience” table to see suggested areas of improvement.
- “View data about indexed pages” for historical information.
Common reasons that Google doesn’t index a URL include 404 errors, having a noindex tag, or that your URL is blocked by a robots.txt file.
FAQs
Does Google Search Console include paid?
Google Search Console shows organic data only.
What is Google Search Console?
The Google Search Console is a collection of tools that enables you to monitor the operation of your website, identify problems, and improve its Google ranking. It’s a free online tool Google offers with details about your website and the users who visit it.
How Do I Use Google Search Console?
When learning how to use Google Search Console, first add your website to Google Search Console. Then, set up operations you want to look to optimize consistently. Next, submit a sitemap, and finally, learn metrics for refining and reporting purposes after putting the Google Search Console to work.
How to Set Up Google Search Console
Start by signing into your Google Account, opening Google Search Console, and adding your site. Finally, add your domain or URL prefix to verify your account and begin taking advantage of the features.
What is GSC?
GSC stands for Google Search Console, a free tool provided by Google that lets users check the search health of their websites.
How do I add users to Google Search Console?
A Google Search Console property can have a maximum of 100 users. To add a new property, head to Settings, click on Users & permissions, click Add user, enter their Google Account email, and choose their permission level.
What does GSC do?
Google Search Console is Google’s free tool that lets you see how well your site is indexed and performing on Google.
Conclusion
Google Search Console gives you powerful insights into how your site performs, as well as what you can do to keep Google’s attention.
Once you learn how to use Google Search Console more efficiently, you can start to get the most out of it. You’ll soon be able to uncover performance search results, add a site map, and see how your Core Web Vitals measure up. And that’s just for a start.
By analyzing the data provided by GSC, you can also identify issues with your website, such as crawl errors, broken links,
Google Console also helps you maximize your traffic and optimize your site’s performance. The best part? It’s free!
Are You Using Google Ads? Try Our FREE Ads Grader!
Stop wasting money and unlock the hidden potential of your advertising.
- Discover the power of intentional advertising.
- Reach your ideal target audience.
- Maximize ad spend efficiency.