 Sign In








How B2B and B2C Companies Measure CRO Success
Info
-
Source: NP Digital
-
Date: July 2026
-
Category: Measurement & Strategy
-
Study Methodology: Surveyed 300 companies to see what they struggle with most in CRO. B2B and B2C response rates reported separately.
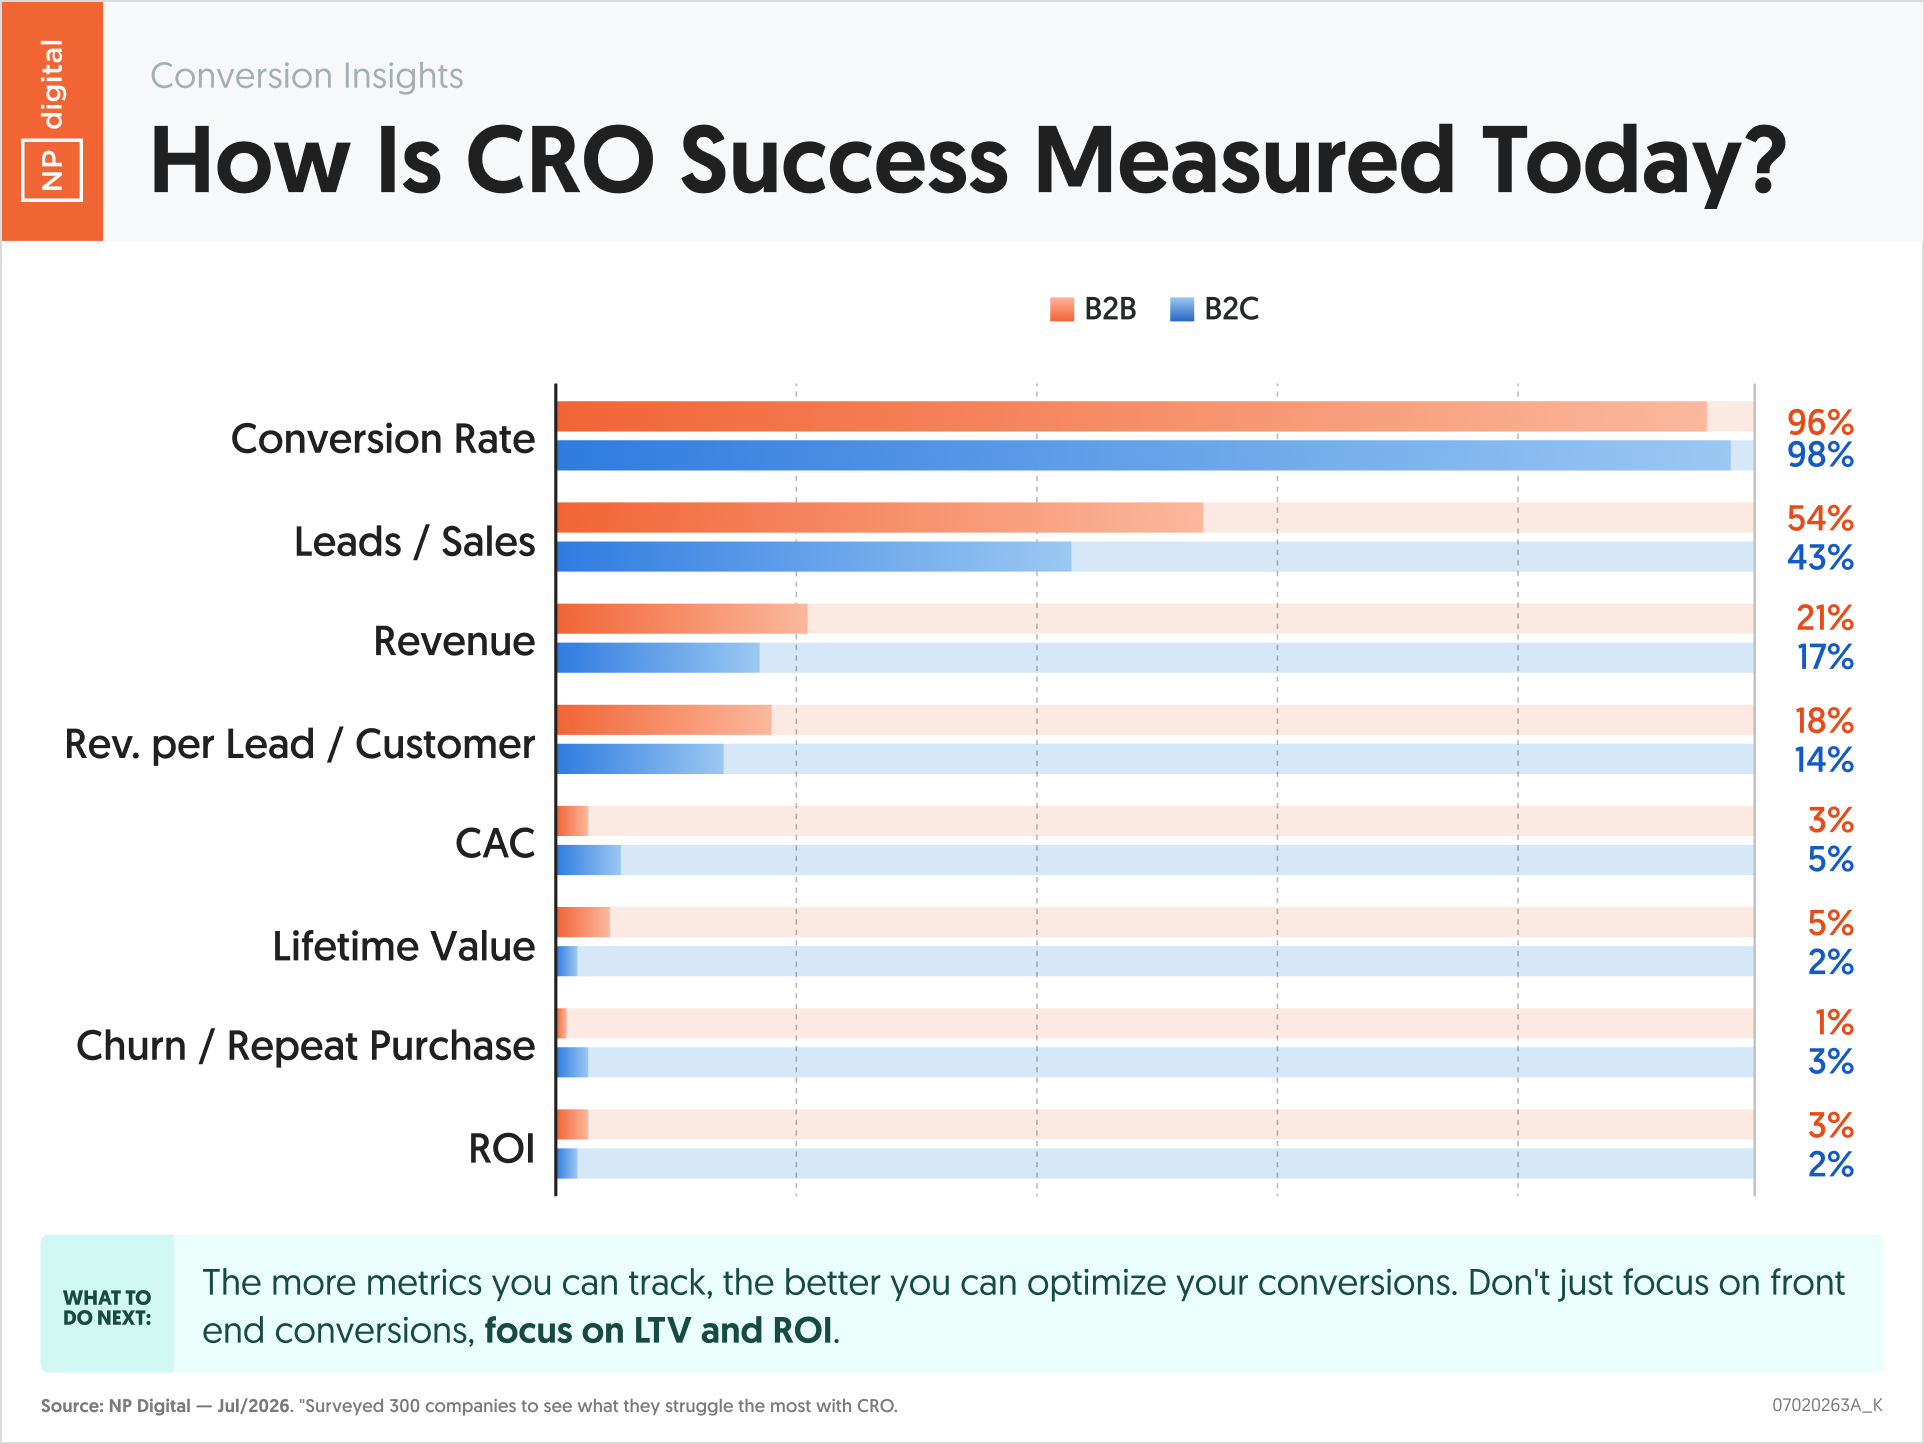
Conversion rate is the near-universal CRO success metric for both B2B and B2C companies. But what marketers measure beyond that primary metric reveals a significant gap: revenue-outcome metrics like lifetime value, ROI, and churn are tracked by fewer than 5 percent of companies on either side. CRO programs that stop at conversion rate are optimizing for an intermediate metric rather than the business outcomes that drive long-term value.
Essential Statistics
- Conversion rate is tracked by 96 percent of B2B companies and 98 percent of B2C companies, the near-universal primary CRO metric for both segments.
- Leads and sales are tracked by 54 percent of B2B companies and 43 percent of B2C companies as secondary CRO success metrics.
- Revenue is tracked by 21 percent of B2B companies and 17 percent of B2C companies.
- Revenue per lead or customer is tracked by 18 percent of B2B and 14 percent of B2C companies.
- CAC is tracked by 3 percent of B2B and 5 percent of B2C companies.
- Lifetime value is tracked by only 5 percent of B2B and 2 percent of B2C companies, and ROI by 3 percent of B2B and 2 percent of B2C companies.
Key Takeaways
- The near-universal reliance on conversion rate as the primary CRO metric reflects the accessibility of the metric rather than its completeness as a success indicator. Conversion rate measures whether a visitor took a desired action but says nothing about the quality, revenue, or lifetime value of that conversion.
- Leads and sales at 54 percent for B2B and 43 percent for B2C as secondary metrics show that roughly half of companies track at least one outcome metric beyond conversion rate. The other half are measuring CRO success entirely through the intermediate metric of conversion rate alone.
- Revenue being tracked by only 21 percent of B2B and 17 percent of B2C companies confirms that most CRO programs are not directly connected to revenue reporting. This disconnect makes it difficult to make the business case for CRO investment based on demonstrated revenue return.
- LTV at 5 percent for B2B and 2 percent for B2C is the most significant measurement gap in the dataset. CRO changes that improve conversion rate while reducing customer quality, such as optimizations that attract higher-converting but lower-value buyers, are invisible without LTV tracking.
- ROI at 2 to 3 percent across both segments confirms that the vast majority of CRO programs cannot demonstrate their own return on investment. This measurement gap is a primary reason why CRO budgets remain constrained relative to the revenue they could generate.
Actionable Insights
- Add revenue per conversion as a secondary success metric in your next CRO reporting cycle. Many teams are running tests without knowing whether winning tests actually improve revenue, not just conversion count. Linking your testing platform data to your CRM or revenue data closes this gap and converts CRO reporting from a traffic-to-conversion story to a traffic-to-revenue story.
- Build an LTV proxy metric for CRO even if full LTV modeling is not yet in place. At 2 to 5 percent LTV tracking, most teams cannot assess whether CRO changes improve or degrade customer quality. A simple proxy, such as average order value for B2C or average deal size for B2B, tracked alongside conversion rate, provides the quality signal that conversion rate alone cannot deliver.
- Connect your CRO metrics to a CAC calculation to make the investment case for testing programs. CAC is tracked by only 3 to 5 percent of companies despite being directly affected by CRO performance. A team that can show leadership that its testing program reduced CAC by 15 percent has a more compelling budget argument than one that can only show a conversion rate improvement.
- Use the ROI measurement gap as an opportunity to differentiate your CRO program internally. If fewer than 3 percent of companies track CRO ROI, demonstrating that your program delivers measurable return positions it as a strategic investment rather than a testing activity. Even a rough ROI calculation, testing hours spent plus tool cost divided by incremental revenue from winning tests, creates the accountability framework that justifies sustained investment.
- Do not abandon conversion rate as a primary metric. It remains the most actionable real-time signal in a testing program. The goal is to add one downstream revenue metric alongside it, not to replace it. A dashboard that shows conversion rate plus revenue per conversion plus 90-day LTV for new customers acquired through each test gives you the complete performance picture that conversion rate alone cannot provide.
”Ninety-seven percent of CRO programs track conversion rate. Three percent track ROI. That gap explains why CRO budgets stay small. If you cannot demonstrate that your testing program generates more revenue than it costs, you are always fighting for resources instead of growing them. Add one revenue metric to your CRO dashboard and that conversation changes.” – Neil Patel’