 Sign In






 Ubersuggest
  AnswerThePublic
 How High-ROAS Companies Allocate PPC Budgets Differently
Info
-
Source: NP Digital
-
Date: April 2026
-
Category: Paid Ads
-
Study Methodology: Data from 50 companies running Google and Meta ads. Findings compare budget allocation percentages across PPC spend categories between companies with ROAS at or below 2.5x and companies with ROAS above 2.5x.
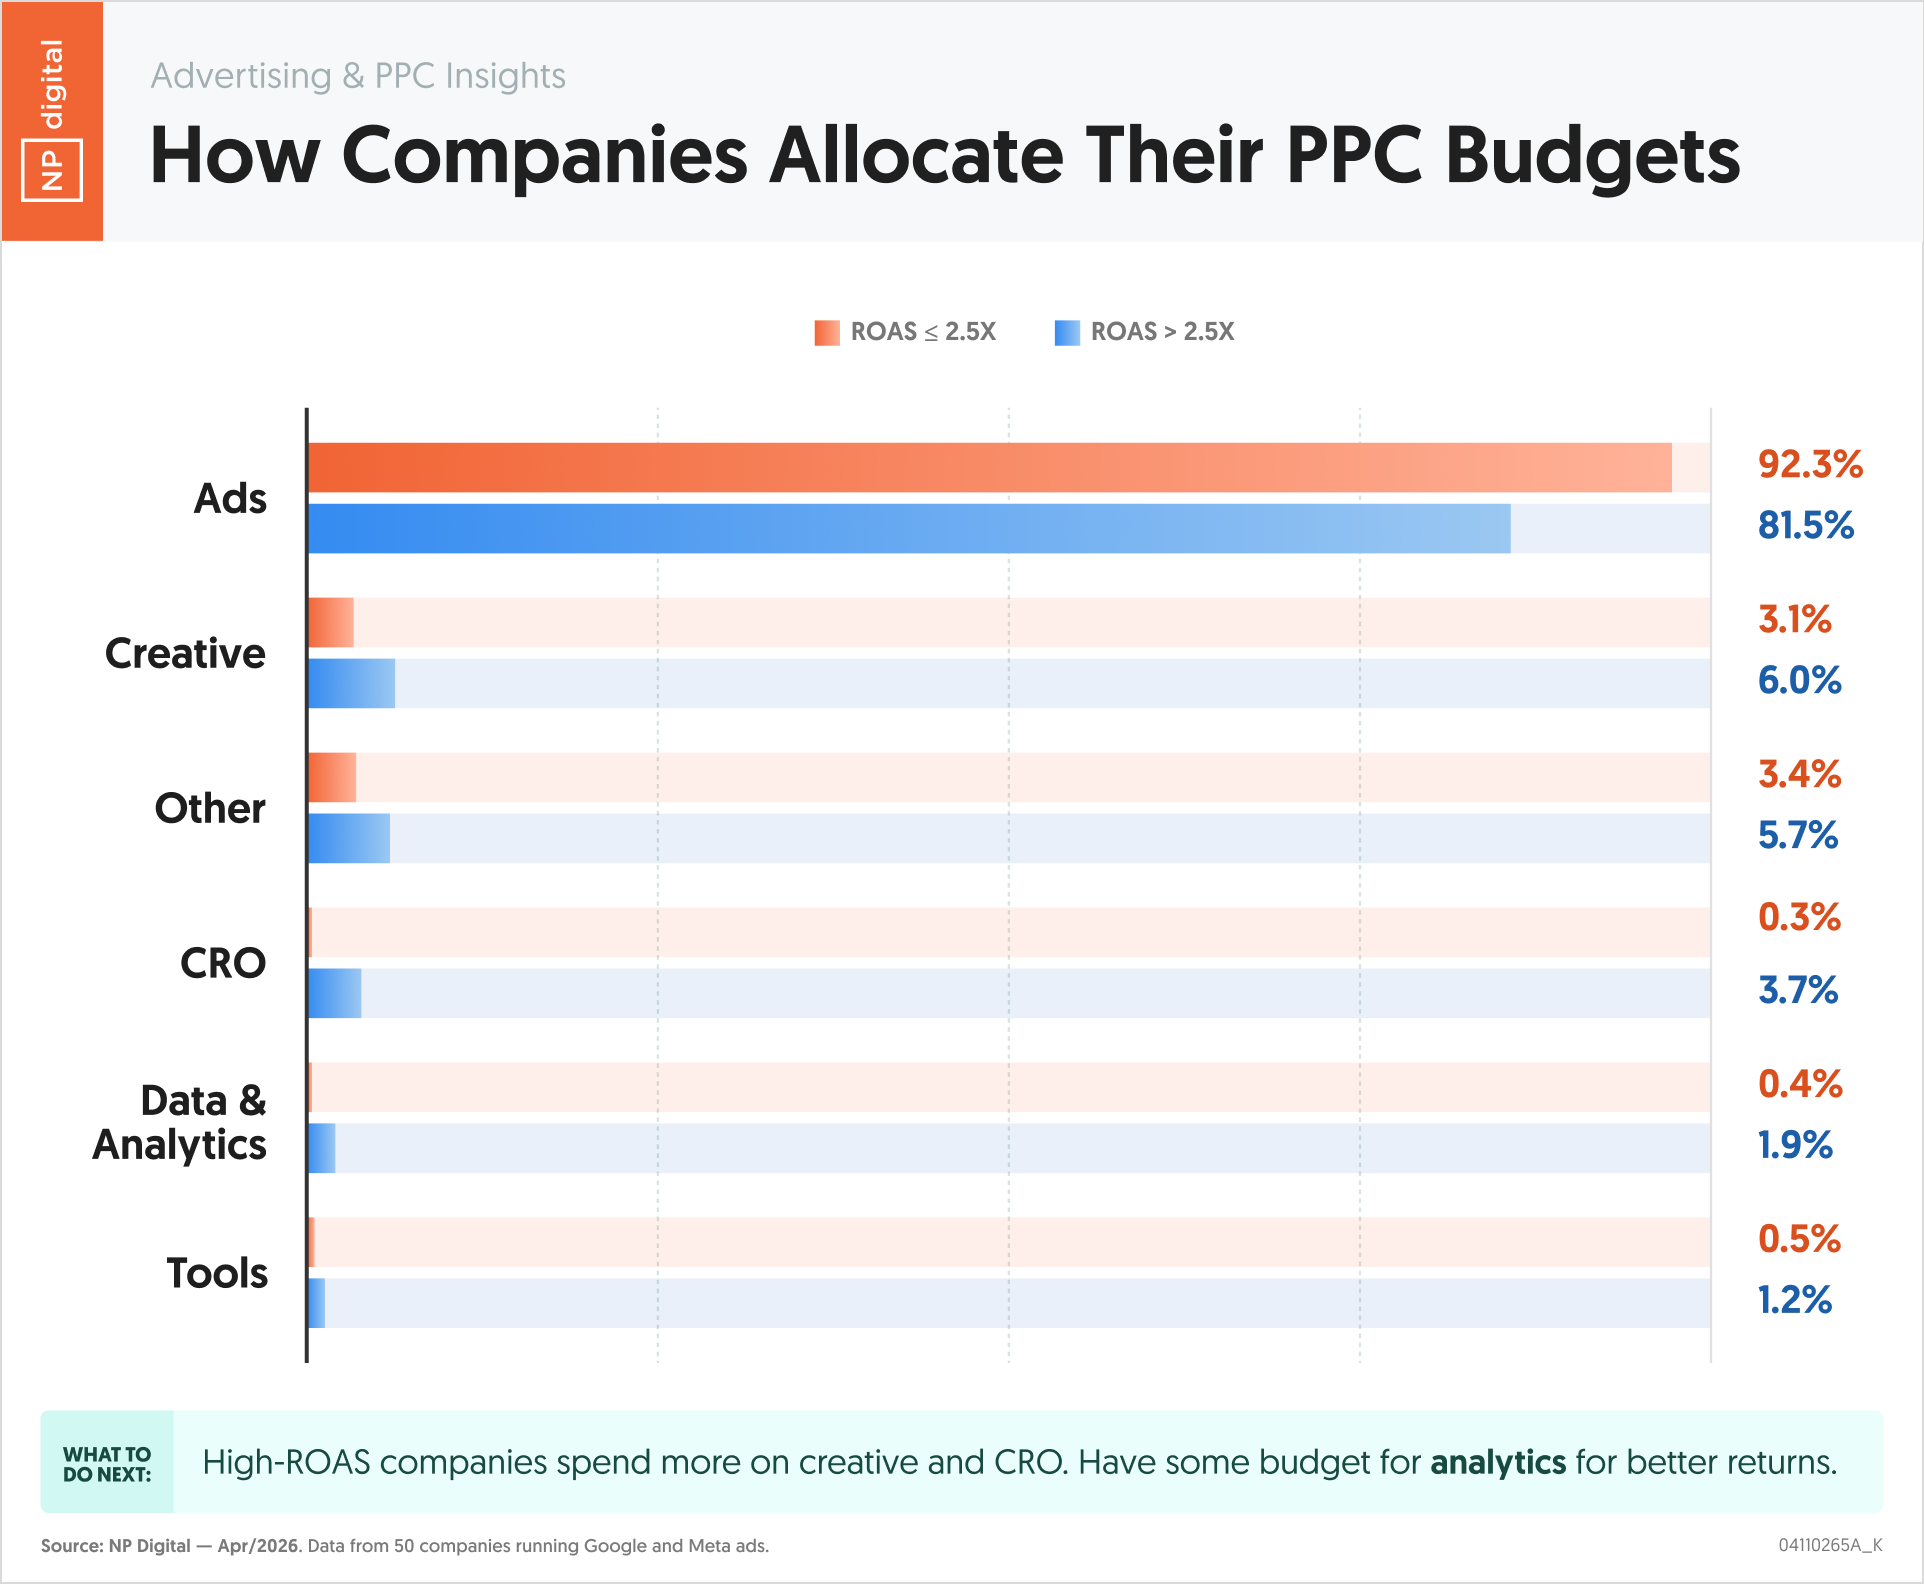
Where you put your PPC budget reveals what you think drives performance. This chart compares budget allocation patterns between companies achieving ROAS above 2.5x and those at or below that threshold. The differences are not dramatic in absolute terms, but the pattern is consistent: high-ROAS companies spend proportionally more on creative, CRO, analytics, and tools, while lower-ROAS companies funnel a higher share directly into ad spend.
Essential Statistics
- Low-ROAS companies allocate 92.3 percent of their PPC budget to ads, compared to 81.5 percent for high-ROAS companies.
- High-ROAS companies spend 6.0 percent of budget on creative, nearly double the 3.1 percent allocated by low-ROAS companies.
- CRO investment shows the largest proportional gap: high-ROAS companies allocate 3.7 percent to CRO versus 0.3 percent for low-ROAS companies, more than a 12x difference.
- Data and analytics spending is 1.9 percent for high-ROAS companies versus 0.4 percent for low-ROAS companies, a 4.75x difference.
- High-ROAS companies allocate 1.2 percent to tools compared to 0.5 percent for low-ROAS companies.
- The combined non-ad budget for high-ROAS companies totals approximately 18.5 percent, versus 7.7 percent for their lower-performing counterparts.
Key Takeaways
- High-ROAS companies do not spend more on ads. They spend less on ads and redirect that budget toward creative, CRO, analytics, and tools that make each ad dollar work harder.
- The CRO gap is the most striking finding. A 12x difference in CRO allocation between high and low-ROAS companies suggests that landing page and conversion path optimization is a defining differentiator in paid performance, not an optional add-on.
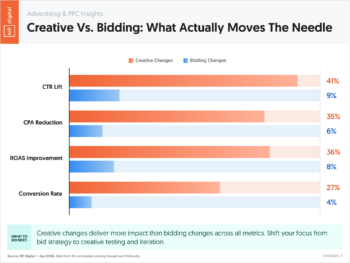
- Creative investment at nearly double the rate for high-ROAS companies aligns with the broader finding that creative changes drive the largest performance improvements in paid campaigns. The allocation data confirms that top performers are funding that insight.
- Analytics spending at 4.75x higher for high-ROAS companies reflects a measurement infrastructure advantage. You cannot optimize what you do not measure, and high-ROAS companies are clearly investing in the data layer required to identify optimization opportunities.
- The pattern suggests a compound advantage: better creative drives higher CTR, better CRO converts more of that traffic, and better analytics surfaces the next optimization faster. Low-ROAS companies are spending more on ads to compensate for weaknesses in each of those supporting areas.
Actionable Insights
- Audit your current PPC budget allocation and compare it to the high-ROAS benchmark. If you are spending more than 85 percent on ads and less than 4 percent on creative, less than 2 percent on CRO, and less than 1 percent on analytics, your allocation profile matches the low-ROAS group in this data. Rebalancing toward the high-ROAS pattern is a structural change, not just a tactic.
- Start the rebalancing with CRO, where the gap is most extreme. Moving from 0.3 percent to even 1 to 2 percent of PPC budget toward CRO work, whether that is landing page testing, form optimization, or checkout improvements, addresses the highest-leverage gap between low and high-ROAS allocation patterns.
- Frame creative and CRO budget increases as ROAS investments, not cost centers. The allocation data shows that high-ROAS companies spend less on ads as a percentage. Redirecting 5 to 10 percent of ad budget toward creative and CRO is not cutting media spend. It is reallocating toward the inputs that drive better returns on the remaining media budget.
- Build a minimum analytics infrastructure before scaling ad spend. High-ROAS companies invest 4.75 times more in data and analytics. Without the measurement layer to identify which creatives, audiences, and landing pages are driving conversions, increasing ad spend produces louder noise rather than a clearer signal.
- Use the tool allocation gap as a prompt to evaluate your current MarTech stack against your paid performance goals. High-ROAS companies spend 2.4 times more on tools. Identify which tools your team lacks that would improve creative testing speed, attribution accuracy, or CRO workflow efficiency, then cost them against potential ROAS improvement.
“The companies with the highest ROAS are not outspending their competitors on ads. They are outspending them on creative, CRO, and analytics, and spending less on ads as a result. That is the allocation pattern this data reveals, and it is the opposite of what most teams do when performance slips.” – Neil Patel