 Sign In







 Ubersuggest
  AnswerThePublic
 Lead Quality Consistency Across Locations
Info
-
Source: NP Digital
-
Date: May 2026
-
Category: Lead Gen & B2B
-
Study Methodology: Sample size: 180 local businesses. Data source: NP Digital survey. Collection method: Online survey. Numbers rounded for clarity.
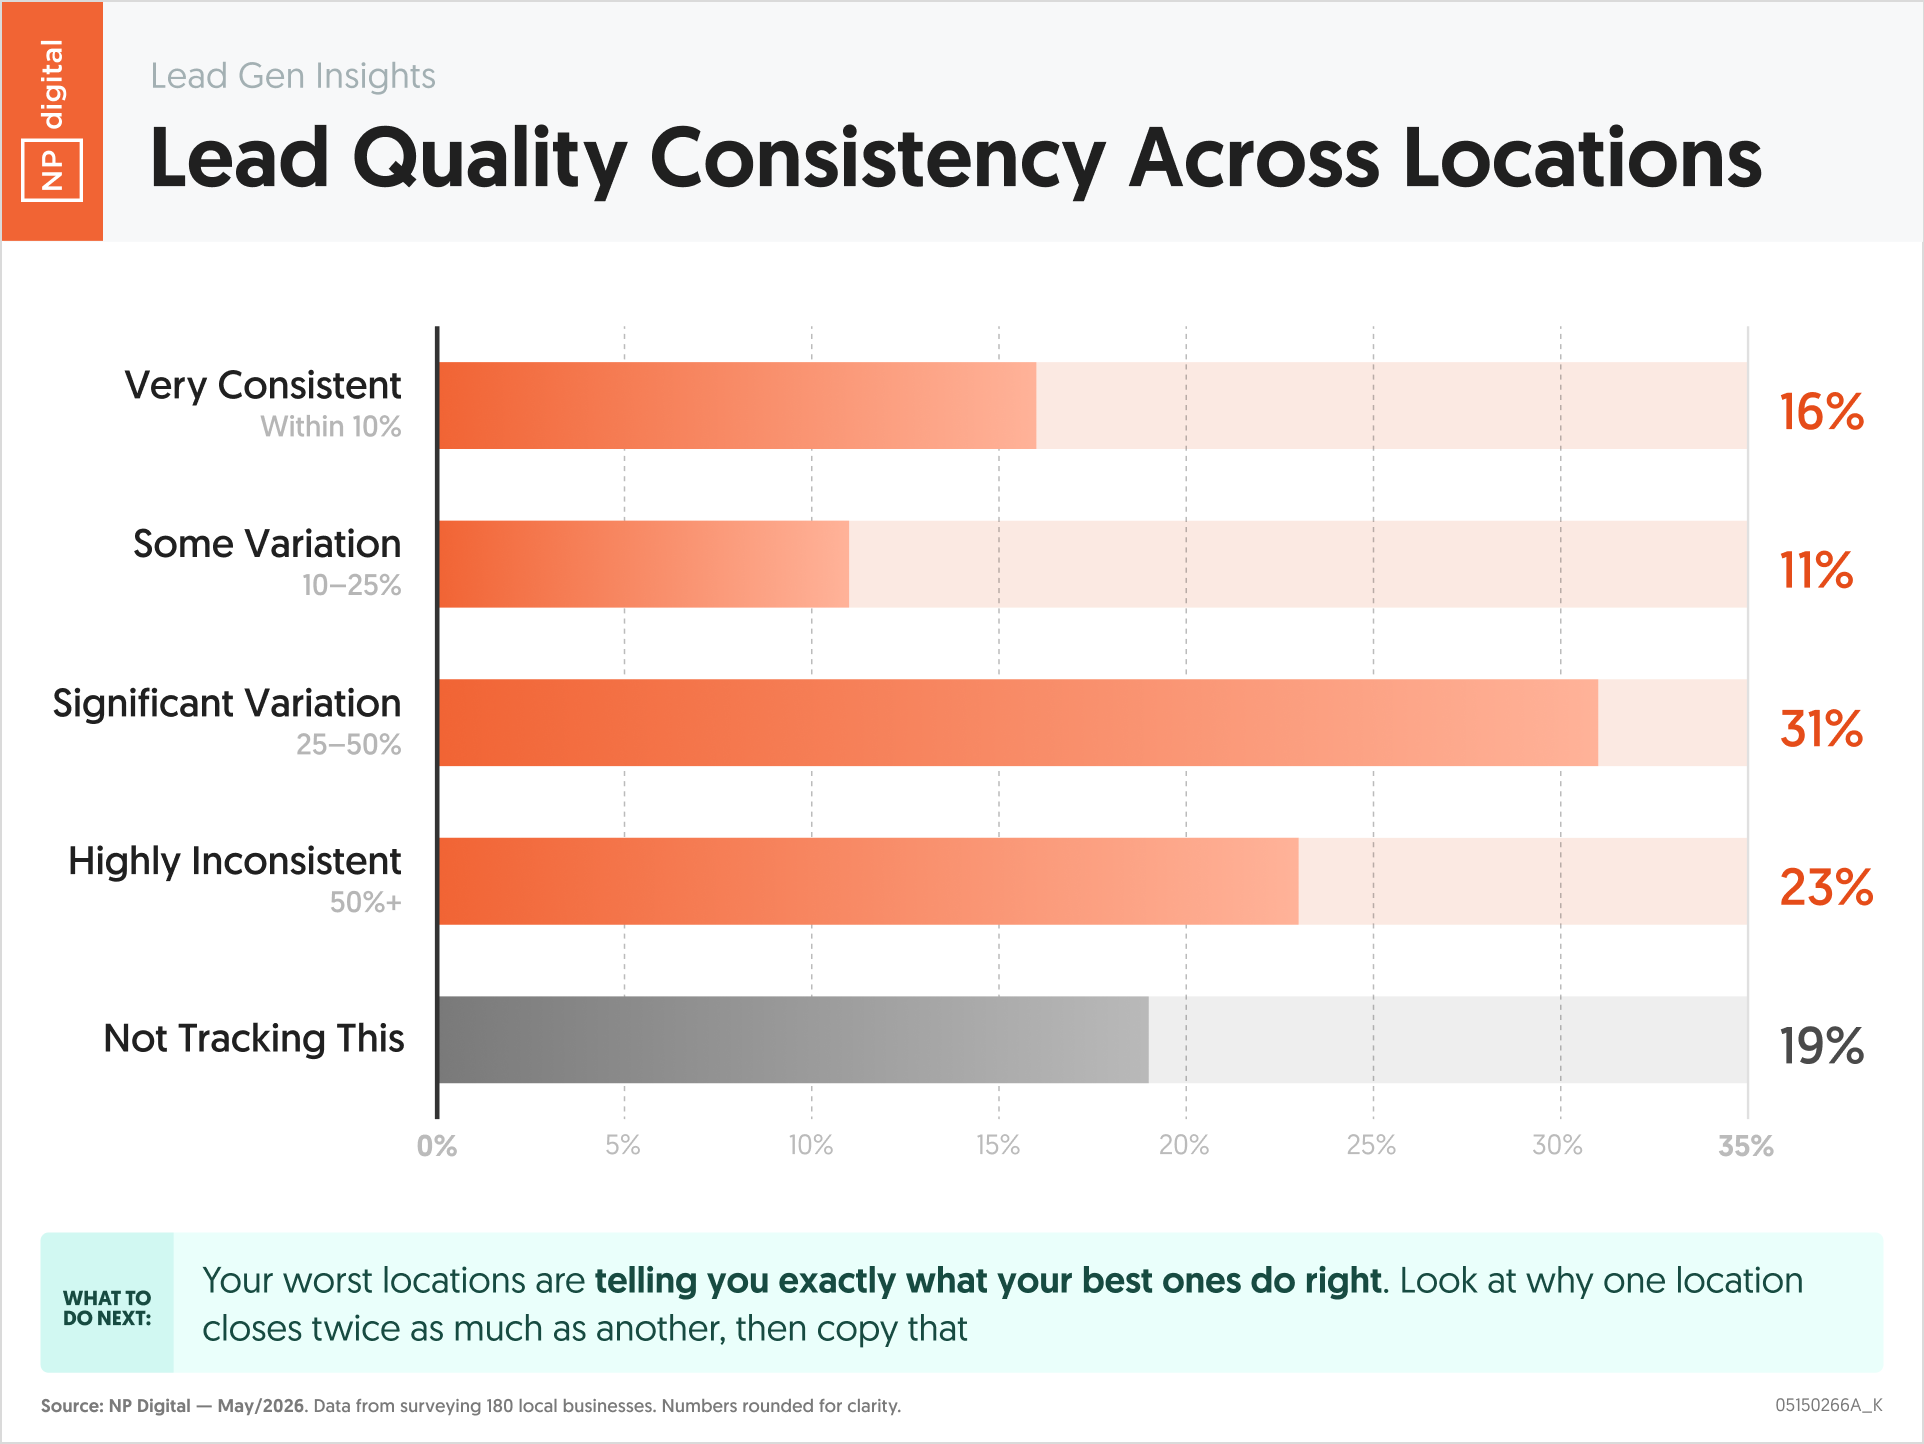
Lead quality variation across locations is one of the most expensive problems in multi-location marketing, and one of the least frequently diagnosed. This survey of 180 local businesses finds that 54 percent of multi-location businesses experience significant or highly inconsistent lead quality variation, and 19 percent are not tracking quality consistency at all. When one location closes deals at twice the rate of another, the performance gap rarely comes down to sales skill alone. It reflects differences in targeting precision, content relevance, channel mix, and lead qualification criteria that the marketing function controls but often fails to monitor at the location level.
Essential Statistics
- 31 percent of multi-location businesses report significant variation in lead quality across locations, defined as a 25 to 50 percent difference in quality metrics between locations.
- 23 percent report highly inconsistent lead quality, with variation exceeding 50 percent across their location portfolio.
- A combined 54 percent experience significant or highly inconsistent lead quality variation across locations.
- 19 percent are not tracking lead quality consistency across locations at all.
- Only 16 percent report very consistent lead quality, defined as within 10 percent variance across all locations.
- 11 percent report some variation in the 10 to 25 percent range, the only other category with consistent quality.
Key Takeaways
- The 54 percent experiencing significant or highly inconsistent lead quality are experiencing a marketing problem that shows up in the sales data. Lead quality variation at that scale reflects differences in how each location’s marketing is attracting, qualifying, and handing off leads. The location with better lead quality is doing something differently upstream in the funnel, and identifying and replicating that difference is the highest-ROI available action for underperforming locations.
- The 23 percent with highly inconsistent quality are operating with two completely different lead generation programs within the same organization. At that level of variation, the gap cannot be explained by minor targeting differences or local market characteristics alone. It signals a fundamental disconnect in the channels being used, the qualification criteria being applied, or the landing page and offer alignment between locations.
- The 19 percent not tracking lead quality consistency are making location-level marketing investment decisions without the data needed to evaluate whether those investments are working. They may be aware that some locations perform better in terms of revenue, but without quality tracking they cannot identify whether the performance gap originates in lead quality, sales execution, or both. This distinction matters because the remedies are entirely different.
- Only 16 percent reporting very consistent lead quality reflects the genuine difficulty of maintaining quality alignment across a distributed portfolio. Achieving tight quality consistency requires standardized targeting criteria, consistent channel mix, comparable landing page quality, and aligned qualification handoff processes across every location.
- The compounding cost of lead quality inconsistency is rarely captured in standard marketing reporting. Wasted sales effort on low-quality leads has a direct cost in sales capacity. Inflated lead volume needed to compensate for low-quality drives up channel spend. The difficulty of forecasting revenue from a portfolio with wide quality variance increases planning costs.
Actionable Insights
- Build a location-by-location lead quality scorecard before making any changes to campaign targeting or channel mix. The 54 percent with significant or highly inconsistent quality need a diagnostic baseline before they can act effectively. Pull lead-to-opportunity and opportunity-to-close conversion rates for each location over the past 90 days and rank locations by quality outcome. The gap between your best and worst locations defines the improvement opportunity and reveals which locations to study for what is working.
- Conduct a detailed analysis of your top-converting locations to identify the specific marketing inputs that differentiate them from underperforming locations. The comparison should cover five dimensions: the channels driving lead volume, the landing pages or lead capture mechanisms in use, the targeting parameters for paid campaigns, the keyword and content focus for organic traffic, and the qualification criteria applied at the marketing-to-sales handoff. The differences you find in these dimensions are your replication roadmap.
- Create a shared lead qualification rubric that standardizes the definition of a qualified lead across all locations and requires consistent application by both marketing and sales. High-quality variation often traces back to different implicit definitions of a good lead at different locations. A shared rubric with explicit criteria removes the definitional ambiguity that allows quality to diverge.
- Require lead source and quality tagging at the location level for every lead record in your CRM, including leads that do not convert. The 19 percent not tracking quality at all cannot diagnose the problem without data. At minimum, every lead record should include the originating location, the source channel, the disposition at each sales stage, and the final outcome.
- Establish a quarterly joint review between marketing and sales that specifically examines lead quality metrics by location, not just volume and revenue. Lead quality problems are almost always visible to sales teams in the form of time wasted on unqualified conversations before they show up in marketing dashboards. A structured quarterly review that requires sales to report on qualification rates and common disqualification reasons by location gives marketing the intelligence needed to adjust targeting before quality divergence compounds further.
“When one location closes at twice the rate of another, the instinct is to look at the sales team. But most of the time the difference originates upstream in marketing: in the targeting, the offer, the channel mix. The data shows you which location to study and which to fix.” – Neil Patel