 Sign In







 Ubersuggest
  AnswerThePublic
 Does Testing More Frequently Drive More Revenue Growth?
Info
-
Source: NP Digital
-
Date: July 2026
-
Category: Website Performance
-
Study Methodology: July 2026. Data from 100 companies generating at least $10 million in annual revenue.
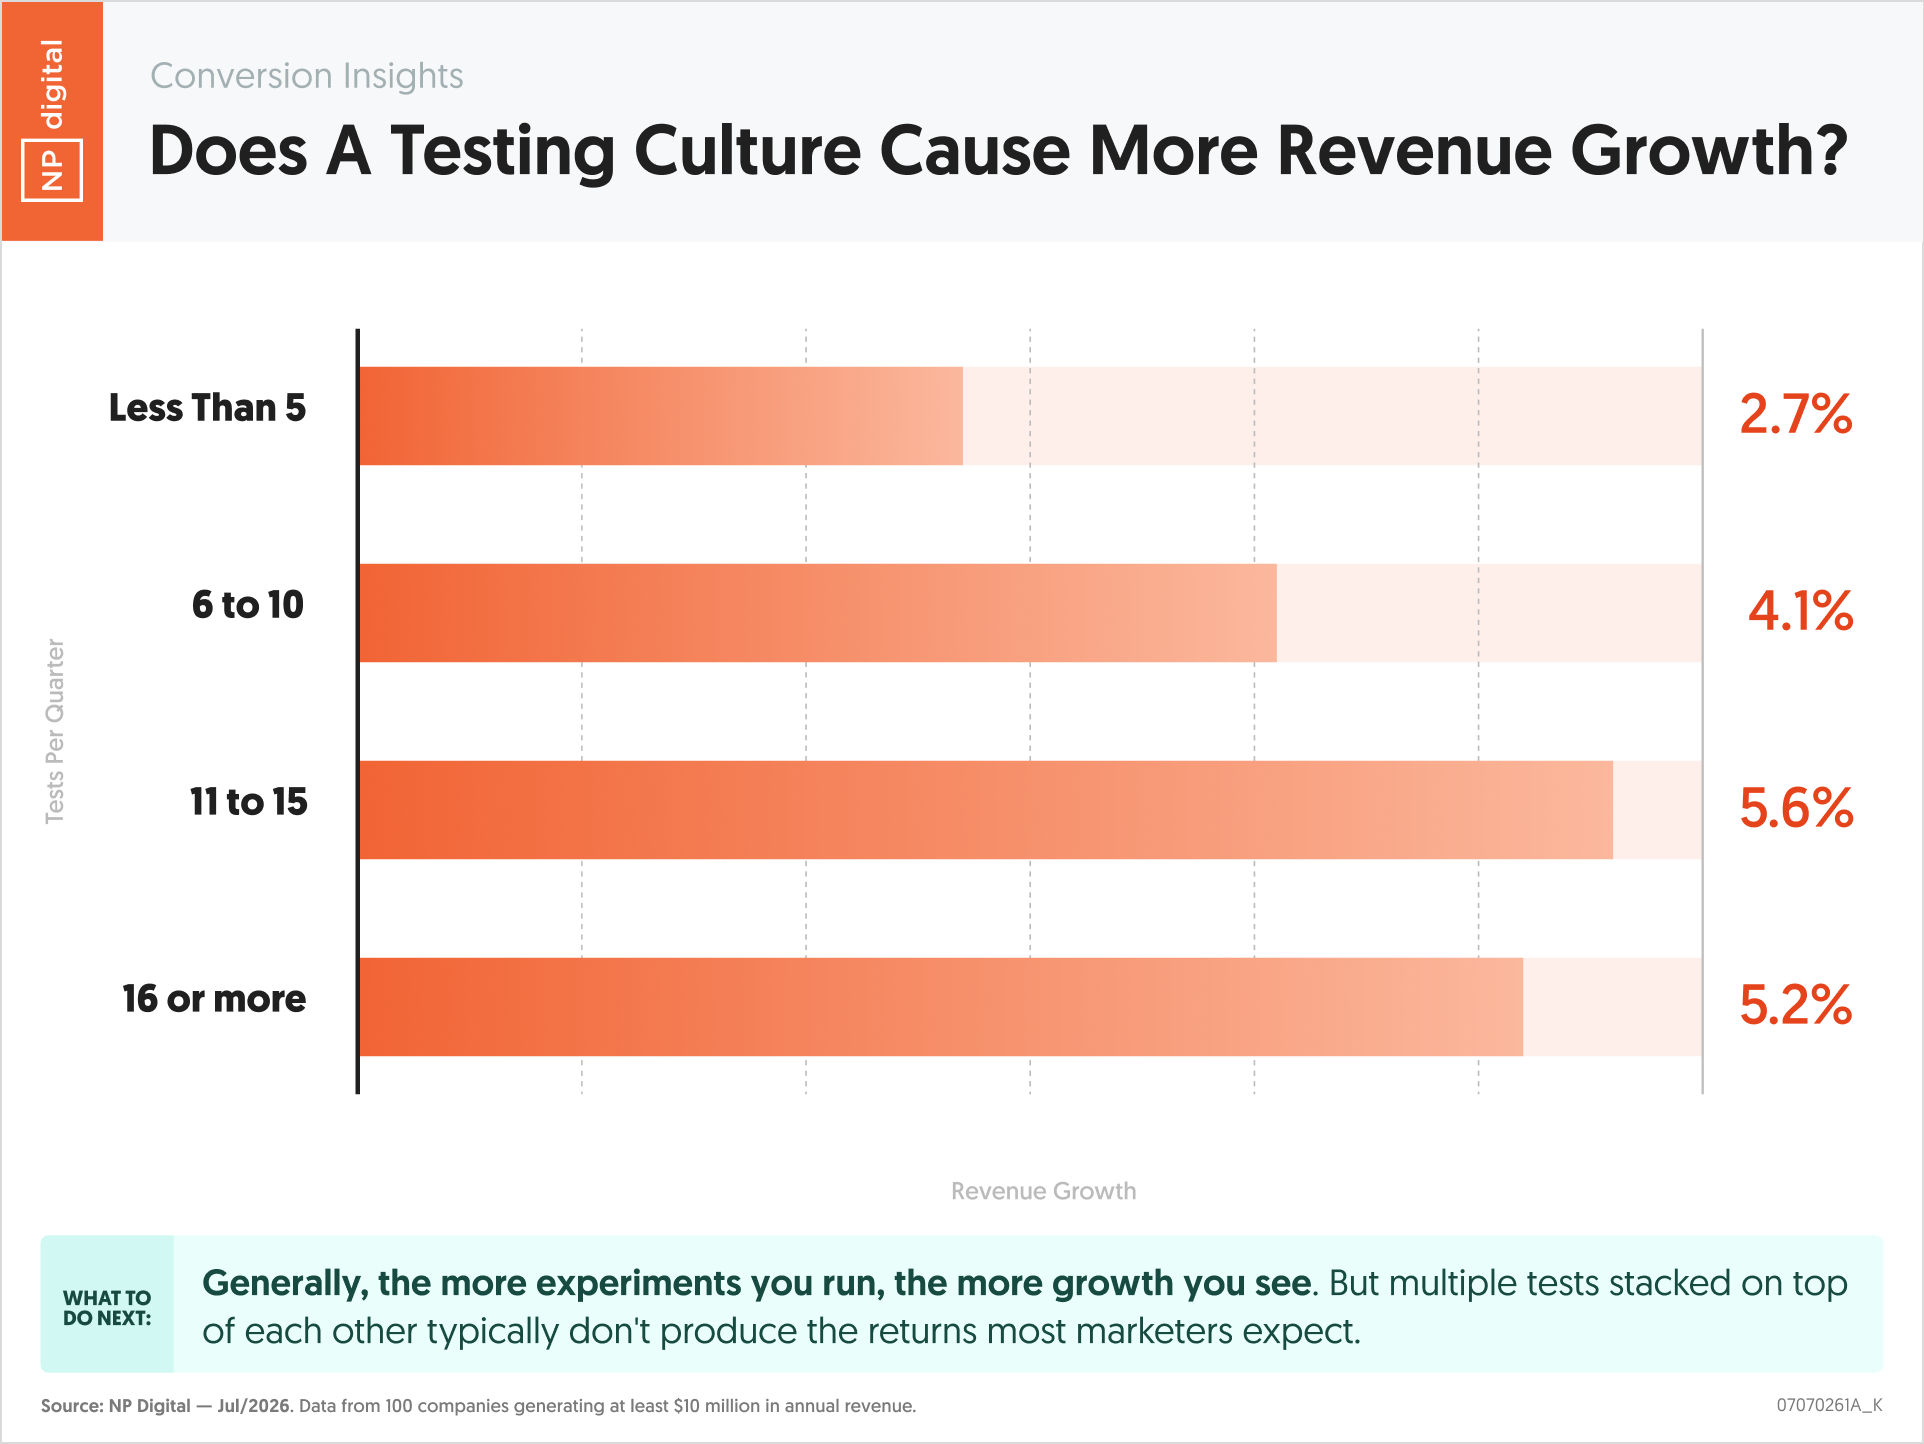
More testing generally produces more revenue growth, but the relationship is not perfectly linear. This data from 100 companies with at least $10 million in annual revenue maps revenue growth rates against quarterly test volume across four testing frequency tiers. The results show a consistent positive relationship from low to high testing frequency, with a slight dip at the highest volume tier suggesting that beyond a certain point, test quality may matter more than additional test quantity.
Essential Statistics
- Companies running fewer than 5 tests per quarter achieve an average revenue growth rate of 2.7 percent.
- Companies running 6 to 10 tests per quarter achieve 4.1 percent average revenue growth.
- Companies running 11 to 15 tests per quarter achieve the highest average revenue growth at 5.6 percent.
- Companies running 16 or more tests per quarter achieve 5.2 percent average revenue growth, slightly below the 11 to 15 tier.
- The data is drawn from 100 companies all generating at least $10 million in annual revenue, controlling for company size as a confounding variable.
Key Takeaways
- The positive relationship between test volume and revenue growth holds consistently from the lowest to the highest frequency tier. Moving from fewer than 5 tests to 6 to 10 tests per quarter produces a 1.4 percentage point revenue growth improvement, and moving from 6 to 10 to 11 to 15 produces another 1.5 point gain.
- The slight dip at 16 or more tests per quarter, from 5.6 to 5.2 percent, suggests a practical upper limit to the benefit of volume alone. At very high test volumes, managing test quality, hypothesis rigor, and result validity becomes harder, which may explain why growth does not continue compounding at the highest tier.
- The 11 to 15 tests per quarter sweet spot represents roughly one to two tests per week. This is a cadence achievable by a dedicated CRO team without requiring enterprise-scale tooling or headcount, making it a practical target for companies at Stage 3 or 4 CRO maturity.
- The 2.7 to 5.6 percent revenue growth range across tiers represents a meaningful commercial difference. For a $10 million revenue company, the difference between 2.7 and 5.6 percent growth is $290,000 in additional annual revenue, which provides a concrete denominator for calculating the ROI of increasing testing frequency.
- The data controls for company size at $10 million minimum revenue, which reduces but does not eliminate the confounding effect of larger companies having more resources for both testing and growth. The relationship is directionally reliable but should be calibrated against each company’s specific context.
Actionable Insights
- Set 11 to 15 tests per quarter as your target testing cadence if you are currently below that range. The data shows this tier produces the highest average revenue growth without the marginal quality degradation that appears at 16 or more tests. Reaching this cadence from a lower starting point requires building a hypothesis backlog, streamlining your testing workflow, and protecting team time for test development and analysis.
- Calculate the revenue growth gap between your current test volume tier and the 11 to 15 tier to build the internal case for increasing testing frequency. For a $20 million revenue company, the difference between 2.7 percent and 5.6 percent growth is $580,000 per year. That figure, applied to your actual revenue base, converts a testing frequency recommendation into a concrete revenue opportunity that finance and leadership can evaluate.
- If you are already running 16 or more tests per quarter with flat or declining revenue growth improvement, audit test quality rather than adding more tests. The slight dip at the highest volume tier suggests the constraint has shifted from quantity to quality. Review your hypothesis documentation, statistical significance thresholds, and result interpretation process before increasing volume further.
- Use quarterly test count as a leading indicator in your CRO reporting. Revenue growth is a lagging metric. Test volume is a leading metric that predicts revenue trajectory weeks or months before the growth effect shows up in financials. Reporting test volume alongside revenue growth gives leadership visibility into the upstream driver of downstream performance.
- Build a test pipeline that keeps your backlog at 4 to 6 weeks of ready-to-run hypotheses. Reaching and sustaining 11 to 15 tests per quarter requires a continuous input of validated hypotheses. Teams that generate hypotheses on demand typically fall short of target cadence because hypothesis development is slower than test execution. A standing backlog eliminates the bottleneck.
”The companies running 11 to 15 tests per quarter are growing at 5.6 percent. The companies running fewer than 5 are growing at 2.7 percent. That difference is not about talent or strategy. It is about test volume and the compounding learning that comes from it. Find the bottleneck in your testing cadence and remove it.” – Neil Patel