

Key Takeaways
- Vanity metrics are data points that look impressive but don’t impact revenue, growth, or decision-making. Metrics like pageviews or impressions can create a false sense of success without real business value.
- A simple way to identify vanity metrics is to ask “So what?” — if a metric increases but doesn’t lead to meaningful action or outcomes, it’s likely not useful. Easily manipulated metrics are another red flag.
- Common examples include impressions, traffic, and follower counts, which often measure visibility rather than actual engagement or conversions. These numbers only matter when tied to clear business goals.
- The focus should shift to actionable metrics tied to outcomes, like conversions, revenue, and user behavior. Tracking what drives real impact leads to better decisions and sustainable growth.
“The more, the merrier,” said no marketing executive ever while staring at an overloaded performance dashboard.
Pageviews, traffic, conversions — plus a dozen more metrics that essentially tell the same story from different angles.
“But what’s the gist?”
“Hard to say… but hey, our pageviews doubled this month!”
“Of course they did — we tripled our ad spend.”
What is a vanity metric?
Any metric that doesn’t directly impact revenue, growth, or decision-making is a vanity metric.
How to identify a vanity metric
Start by asking the “So what?” question.
If a metric increases, what happens next? If the answer is unclear or meaningless (e.g., “We got more traffic!”), it’s one clue of a vanity metric.
Another thing to check is whether you can manipulate the number easily. If throwing more money at ads or posting more frequently on social media makes the number skyrocket without impacting your bottom line, it’s just noise.
Examples of vanity metrics
The metrics below can be vanity metrics in many cases — but not always. They aren’t inherently useless (otherwise, we could just hand every marketer a checklist and call it a day).
Not sure if a metric is vanity for you? Just run it through the process above.
Impressions
Why it’s vanity: A high impression count only tells you that your ad, post, or listing was displayed — it doesn’t mean anyone cared. A million impressions on a social media post might feel impressive, but if no one clicks, engages, or converts, it’s just background noise.
When it’s not:
- If your goal is brand awareness, impressions can be useful when paired with brand recall surveys or direct traffic growth.
- If you’re running retargeting ads, a high number of impressions might be necessary before people take action.
📌 Example: A company runs a LinkedIn ad campaign and reports “10 million impressions!” But when you check engagement, only 0.2% of viewers clicked. The campaign clearly didn’t drive meaningful interactions.
Pageviews
Why it’s vanity: More pageviews don’t always mean more conversions. When users keep returning to the same page without taking action, or if bots are inflating your traffic, the number is meaningless.
When it’s not:
- If you track pageviews on key pages (e.g., pricing, checkout, demo request) and connect them with conversions.
- If analyzing returning visitor pageviews to gauge interest in high-value content.
📌 Example: A SaaS company celebrates 100,000 pageviews on its blog. But after filtering out low-quality traffic, only 500 visitors clicked on a CTA. Measuring conversion rate per page instead of total pageviews would be a better decision.
Site traffic
Why it’s vanity: A spike in traffic looks nice, but if visitors don’t engage or convert, it’s just noise.
When it’s not:
- When you analyze traffic sources and see a steady flow from high-intent channels (e.g., organic search for bottom-funnel keywords).
📌 Example: An eCommerce store sees a 200% increase in traffic after a viral social media post. But sales don’t budge — most visitors were just curious, not buyers. Instead of celebrating, they should focus on attracting the right audience.
Time on website
Why it’s vanity: More time spent on a site doesn’t mean users are interested — it could mean they’re confused or can’t find what they need.
When it’s not:
- If paired with engagement signals like scroll depth, video views, and button clicks.
- If analyzing how long visitors spend on conversion-focused pages (product pages, checkout flows).
📌 Example: A blog post sees visitors staying for 6+ minutes. At first glance, it looks great! But when reviewing heatmaps, it turns out they stop scrolling halfway. They’re not engaged — they just left the tab open.
Bounce rate
Why it’s vanity: A high bounce rate isn’t always bad, and a low one isn’t always good. It depends on page intent — a landing page should encourage action, but a blog post might naturally have a high bounce rate.
When it’s not:
- When tracking bounce rate for product or landing pages (lower is better).
- If analyzing bounce rate by traffic source (e.g., paid ads might drive unqualified traffic).
📌 Example: A company sees an 80% bounce rate on a blog post and assumes it’s bad. But after checking, they realize most visitors came for quick info, found their answer, and left. Instead of fixing bounce rate, they should add a strong CTA to capture leads.
The number of keywords
Why it’s vanity: Ranking for more keywords doesn’t mean more traffic or better traffic. Many ranked keywords might be irrelevant, low-volume, or low-intent.
When it’s not:
- When purposefully tracking high-intent keywords that actually bring in leads or conversions.
📌 Example: A startup ranks for 500+ keywords, but most are informational with zero conversions. Instead of celebrating, they should double down on bottom-funnel keywords that drive sign-ups.
Total backlinks
Why it’s vanity: A high backlink count means nothing if the links are low-quality, irrelevant, or spammy. A large number of bad backlinks can even hurt your SEO.
When it’s not:
- When analyzing your link profile vs. competitors’ to spot both quantity and quality gaps.
📌 Example: A website owner buys 500 backlinks from a Fiverr link-builder. Ninety percent of those come from low-quality directories. Google sees this as spammy behavior, and their rankings drop. Quality > quantity.
Total conversions
Why it’s vanity: There are several reasons why tracking the sole number of conversions makes no sense.
First, the number alone doesn’t tell you how much each conversion costs. If your campaign brought in 500 conversions but you spent more on ads than you earned, that’s not a win — it’s a loss.
Second, what counts as a conversion? If you’re tracking leads rather than actual sales, the number means little unless those leads are qualified and likely to convert into paying customers.
When it’s not:
- When combined with the cost per conversion to measure profitability. If you’re tracking how much you’re spending per sale or lead, total conversions become meaningful.
📌 Example: Let’s say you run two ad campaigns:
- Campaign A brings in 1,000 conversions at $5 per conversion.
- Campaign B gets 500 conversions, but at $2 per conversion with a higher percentage of buyers.
If you only look at the total conversions, Campaign A seems better. But when factoring in cost per conversion and lead quality, Campaign B might actually drive more revenue and be the smarter investment.
Metrics that are always actionable
Actionable metrics don’t just report on performance — they guide decisions, optimize strategies, and tie directly to revenue.
Here are a few metrics that always provide real insights when tracked in context.
Click-through rate
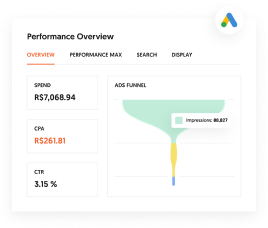
The click-through rate (CTR) is most useful when tracked in context.
Say, you’ve got organic CTR of 15% — that’s a decent number in most scenarios. It suggests your rankings are strong and your search snippet matches intent. But more often than not, you need to track the entire funnel to see if that great organic CTR affects your bottom line at all.
That’s why you need to track CTR at multiple stages in the funnel. A well-structured funnel breaks the path to conversion into steps, and each step has its own CTR. For example:
- Organic CTR — How many searchers click your page?
- On-page CTR — How many visitors click from your blog post to your pricing or product page?
- Final conversion CTR — How many make it to your checkout, sign-up, or contact form?
If your organic CTR is high but your on-page CTR is low, the issue isn’t with rankings — it’s with how your page moves visitors forward. Tracking CTR between steps gives you a clear picture of where drop-offs happen, so you know what to fix.
Conversion rate
Conversion rate tells you how many visitors take a desired action — but like CTR, it’s most useful when tracked in stages rather than as a single number.
A high conversion rate at one step doesn’t guarantee overall success if there are drop-offs later in the funnel. That’s why it’s important to track different types of conversion rates separately:
- Visitor-to-lead conversion rate — How many website visitors turn into leads (e.g., by signing up for a newsletter, downloading a guide, or requesting a demo)?
- Lead-to-customer conversion rate — How many of those leads actually become paying customers?
For example, say your visitor-to-lead conversion rate is 10%, but your lead-to-customer rate is only 1%. That means your lead generation efforts are working, but a vast majority of those leads aren’t qualified. You’ve got to revisit your targeting, messaging, or lead qualification process to ensure you’re attracting the right audience.
Cost per acquisition (CPA)
Cost per acquisition (CPA) tells you how much you’re spending to acquire a customer or lead. It’s one of the most actionable metrics because it ties your marketing spend directly to results.
CPA = Total marketing spend / Number of conversions
To determine whether your cost per lead (CPL) is reasonable, you need to factor in your lead-to-customer conversion rate (see above). Only then can you assess whether your lead generation campaign is actually driving valuable customers.
Qualified leads generated (MQLs & SQLs)
Not all leads are equal. And your reports should reflect that.
Marketing qualified leads (MQLs) are leads that have engaged with your marketing (e.g., downloaded content, signed up for a webinar) but aren’t yet ready to buy. Sales-qualified leads (SQLs) are leads that have been vetted by sales and are considered ready for direct outreach.
When you measure leads or visitor-to-lead conversion rates, you need to separate MQLs from SQLs.
For example, if you’re generating 1,000 MQLs but only 50 SQLs, that’s a sign your lead scoring or qualification criteria need refinement. Tracking both metrics helps you ensure marketing efforts drive leads that actually convert.
Return on ad spend (ROAS)
Return on ad spend (ROAS) measures how much revenue you generate for every dollar spent on ads. It’s the simplest way to gauge ad campaign profitability.
ROAS = Revenue from ads / Ad spend
A ROAS of 3:1 means you’re making $3 for every $1 spent on ads. A strong ROAS depends on your industry, margins, and customer lifetime value (LTV).
Marketing-sourced pipeline revenue
Marketing-sourced pipeline revenue shows how much of your sales pipeline comes from marketing—things like paid ads, blog content, and email campaigns.
It’s a reality check for your marketing efforts. Getting a flood of leads sounds great, but if none of them turn into real sales opportunities, what’s the point?
For example, say your content marketing campaign brings in 500 leads, but only 50 of them make it into your sales pipeline. Meanwhile, a smaller paid ad campaign generates just 100 leads, but 80 of them turn into real deals.
💡 It’s a tricky one, though, because marketing attribution is never black and white. Those high-converting paid ad leads might have already come across your blog content before clicking the ad — maybe that article played a role in their decision. So, can you really say the content campaign didn’t work? Definitely not.
FAQs
What is a vanity metric?
A vanity metric is any metric that looks impressive on the surface but does not directly influence revenue, growth, or decision-making. These numbers may make a report look good but offer little to no actionable insight. Common examples include impressions, total pageviews, or overall site traffic without context.
Which KPI is a vanity metric?
Any KPI can be a vanity metric if it is measured without context or a clear link to business objectives. For example, tracking total social media followers might be a vanity metric if you do not connect it to engagement, conversions, or revenue.
What are SEO vanity metrics?
SEO vanity metrics are search-related numbers that look positive but do not necessarily contribute to meaningful results. Examples include ranking for many low-intent keywords, accumulating a high number of low-quality backlinks, or celebrating traffic spikes that do not lead to conversions.
Any metric taken out of context is a vanity metric
All in all, any metric, even conversion rates, means little without the context.
A low conversion rate might be perfectly fine for high-ticket sales, while sky-high conversion rates could hurt your bottom line if you’ve spent too much to achieve them.
It’s the same with traffic, engagement, or any other metric.
Raw numbers don’t tell the full story. Every metric is only as meaningful as the trends behind it or its impact on the bottom line.
Instead of chasing bigger numbers for the sake of it, focus on how they connect to business growth. Are higher conversion rates translating into profit? Is increased engagement leading to customer retention? Metrics should guide decisions, not just serve as feel-good stats. Otherwise, they’re just another vanity metric in disguise.
Are You Using Google Ads? Try Our FREE Ads Grader!
Stop wasting money and unlock the hidden potential of your advertising.
- Discover the power of intentional advertising.
- Reach your ideal target audience.
- Maximize ad spend efficiency.