
The 5 Stages of Forecasting Maturity: Where Does Your Team Land?
Info
-
Source: NP DIgital
-
Date: June 2026
-
Category: Measurement & Strategy
-
Study Methodology: Percentage of organizations at each forecasting maturity stage. Base: 210 teams.
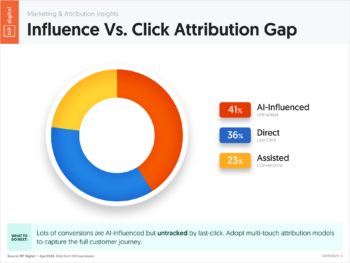
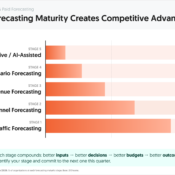
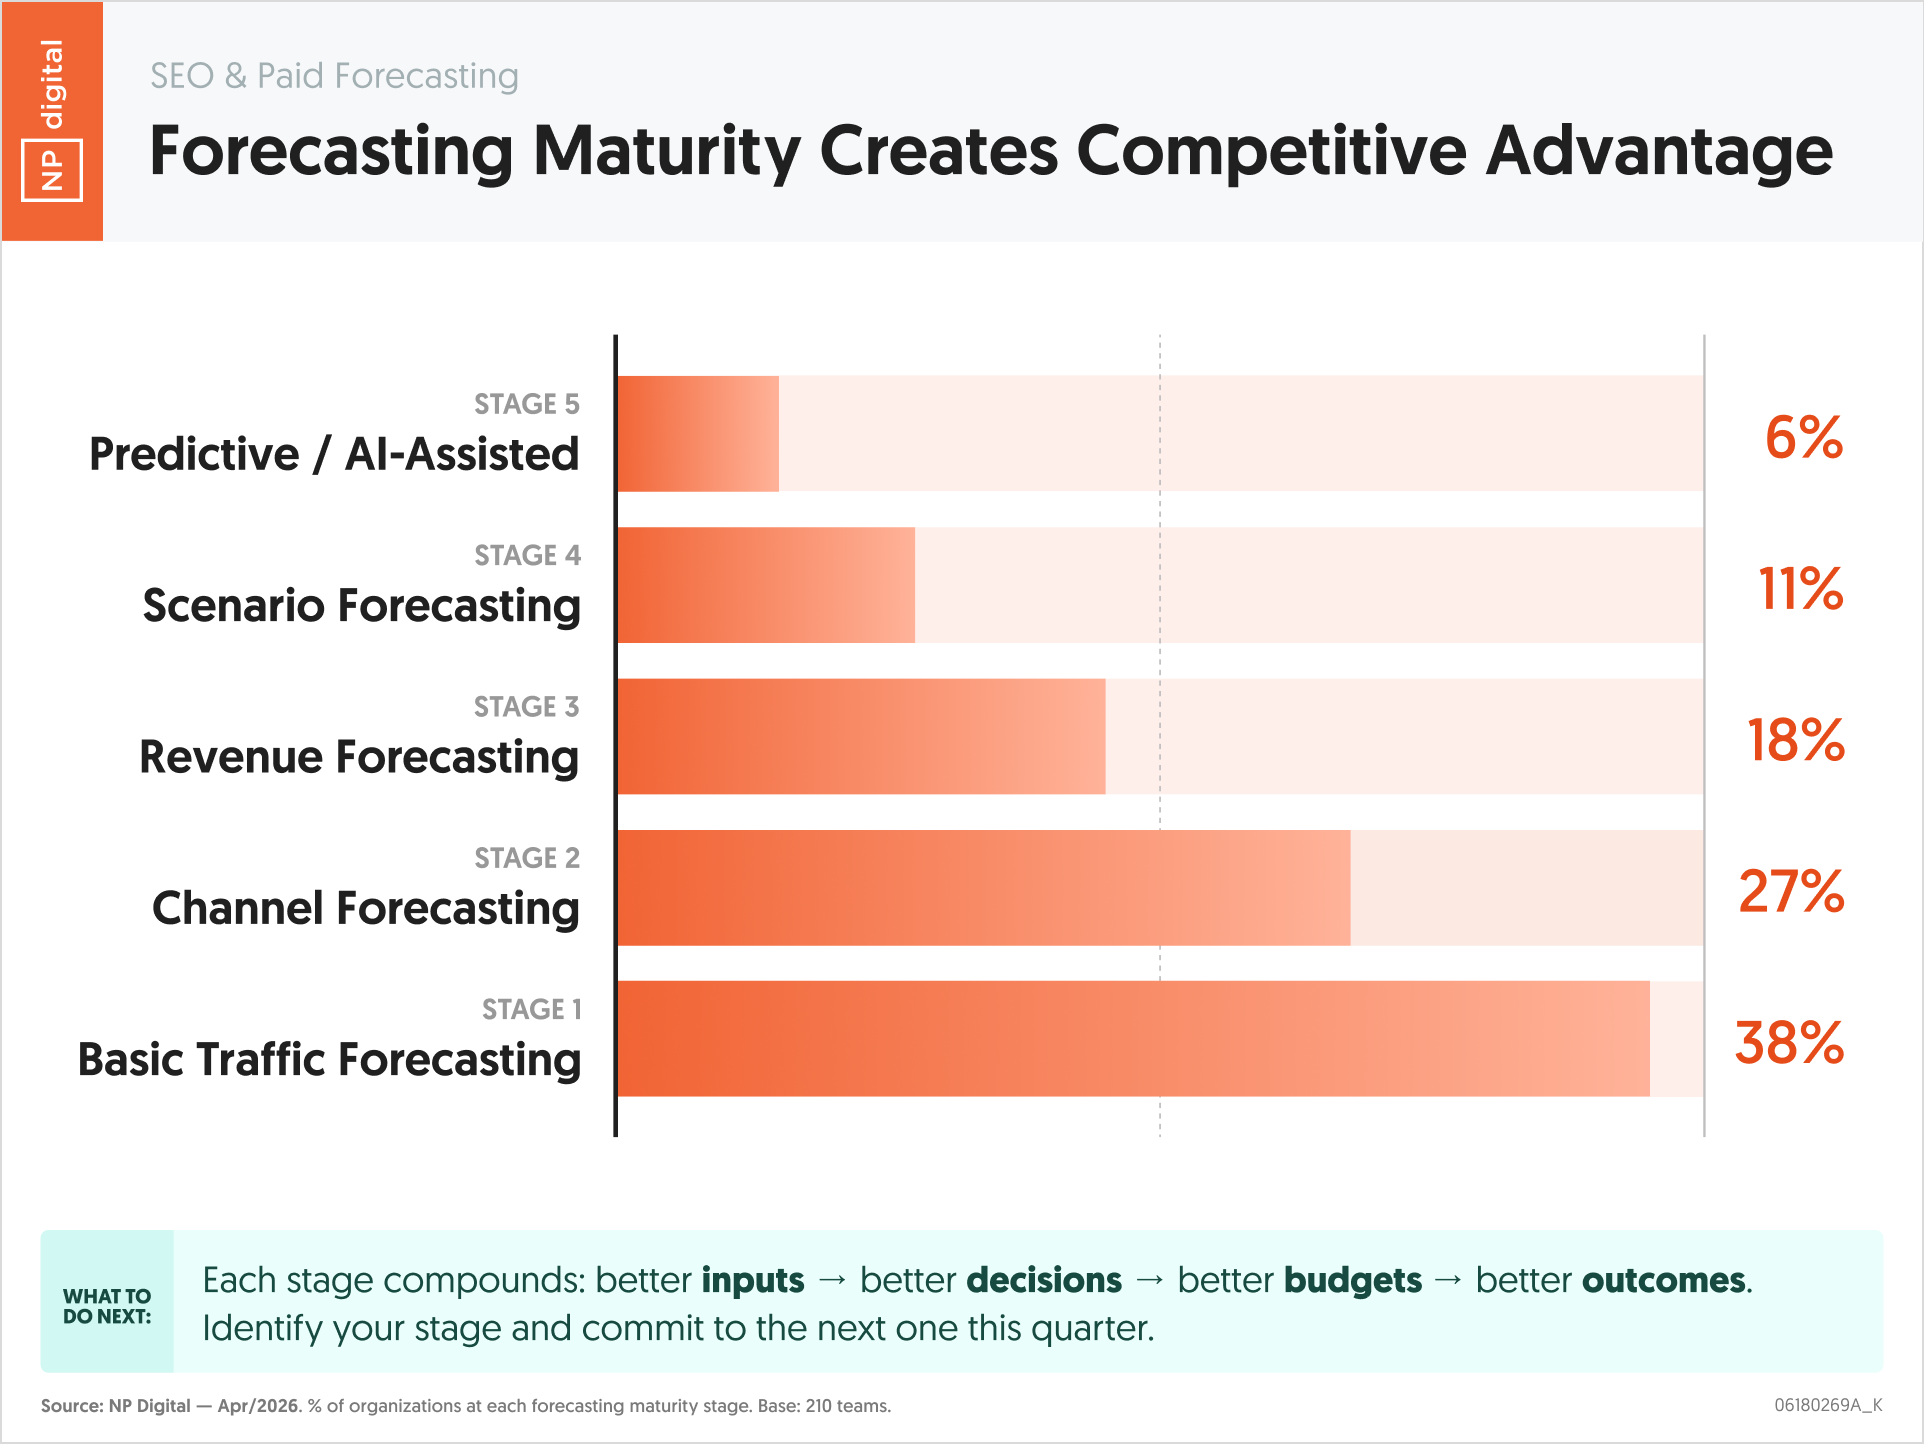
Most marketing teams are forecasting the same way they did five years ago. This survey of 210 teams maps the distribution across five forecasting maturity stages, from basic traffic forecasting through predictive AI-assisted models. The concentration at the bottom two stages, 65 percent of teams at Stage 1 or Stage 2, reveals how much room exists to build a forecasting capability that creates genuine competitive advantage. The 6 percent at Stage 5 are operating with a planning quality that the other 94 percent cannot match.
Essential Statistics
- 38 percent of teams are at Stage 1, basic traffic forecasting, the most common stage in the dataset.
- 27 percent of teams are at Stage 2, channel forecasting, making the bottom two stages combined the largest segment at 65 percent of all teams.
- 18 percent of teams are at Stage 3, revenue forecasting, representing the first stage where business outcomes are directly modeled.
- 11 percent of teams are at Stage 4, scenario forecasting, and 6 percent are at Stage 5, predictive AI-assisted forecasting.
- Only 17 percent of teams are at Stage 4 or above, where forecasting methodology produces a structural planning advantage over the majority of competitors still operating at lower stages.
Key Takeaways
- The 38 percent concentration at Stage 1 means that basic traffic forecasting remains the norm, not the exception. Teams at this stage are measuring sessions and pageviews, which tells leadership where traffic has been, but provides limited basis for projecting revenue or making investment decisions.
- The drop from 27 percent at Stage 2 to 18 percent at Stage 3 marks the most significant transition in the maturity model: the move from channel-level metrics to revenue forecasting. This step requires connecting marketing data to CRM or revenue data, which is where most organizations face the integration barrier that stalls progression.
- The 11 percent at Stage 4 and 6 percent at Stage 5 represent a small group of teams whose forecasting capability is materially better than the market average. These teams are not necessarily larger or better-resourced. They have made the methodological investments that the companion data in this batch identifies: integrated channel forecasting, attribution maturity, and scenario planning.
- Stage 5 predictive AI-assisted forecasting at 6 percent is where the largest competitive gap exists. Teams at this stage can anticipate performance changes before they appear in actuals, giving them the ability to reallocate budget and adjust strategy faster than teams relying on historical data alone.
- The distribution confirms that advancing one stage produces competitive advantage because you are moving into territory that most of your competitors have not reached. A team moving from Stage 1 to Stage 2 is still in the majority. A team moving from Stage 2 to Stage 3 is now ahead of 65 percent of the market.
Actionable Insights
- Identify your current forecasting stage using the five definitions in this chart, then define the specific capability required to advance one stage. Moving from Stage 1 to Stage 2 requires separating your traffic forecast by channel with channel-specific assumptions. Moving from Stage 2 to Stage 3 requires connecting your channel forecast to a revenue model using conversion rates and average deal value. The step is always defined and achievable; the barrier is usually organizational, not technical.
- Prioritize the Stage 2 to Stage 3 transition if you are currently at Stage 2, because this is the step that changes how leadership perceives the marketing function. A revenue forecast positions marketing as a revenue driver rather than a cost center. That shift in perception affects budget credibility, headcount decisions, and the quality of cross-functional conversations with sales and finance.
- Use the 65 percent Stage 1 and Stage 2 market concentration as a competitive framing tool internally. When requesting investment in forecasting capability, the argument is not that your team needs better tools. The argument is that advancing to Stage 3 or Stage 4 puts your organization ahead of 65 to 82 percent of marketing teams on planning quality, which translates directly into better resource allocation decisions.
- Build a one-year forecasting maturity roadmap with one stage advance per two quarters as a realistic target. Moving two full stages in 12 months is achievable for most teams without major technology investment. Stage 1 to Stage 2 requires channel segmentation. Stage 2 to Stage 3 requires revenue integration. Both can be accomplished in spreadsheet models before any dedicated forecasting software is justified.
- Track your forecasting stage as a team KPI alongside campaign performance metrics. Most teams measure whether their campaigns performed well but not whether their forecasting of those campaigns was accurate. Adding forecast accuracy as a standing metric creates the feedback loop that drives maturity advancement, because teams that measure their forecasting errors are the ones that improve their forecasting methodology.
“Sixty-five percent of marketing teams are still at the bottom two forecasting stages. That is not a technology problem. It is a methodology problem. The teams at Stage 4 and Stage 5 are not using more expensive tools. They are connecting their marketing data to revenue data and modeling scenarios instead of projecting single numbers. That is a decision, not a budget requirement.” – Neil Patel