
High-Performing Orgs Forecast Pipeline and Revenue, Not Just Traffic
Info
-
Source: NP Digital
-
Date: June 2026
-
Category: Marketing & Strategy Insights
-
Study Methodology: Percentage of organizations including each KPI in their marketing forecasts. Base: 210 marketers.
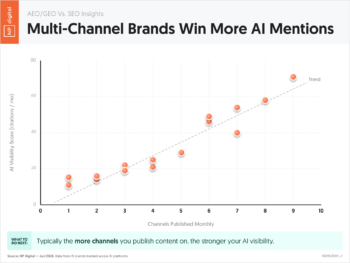
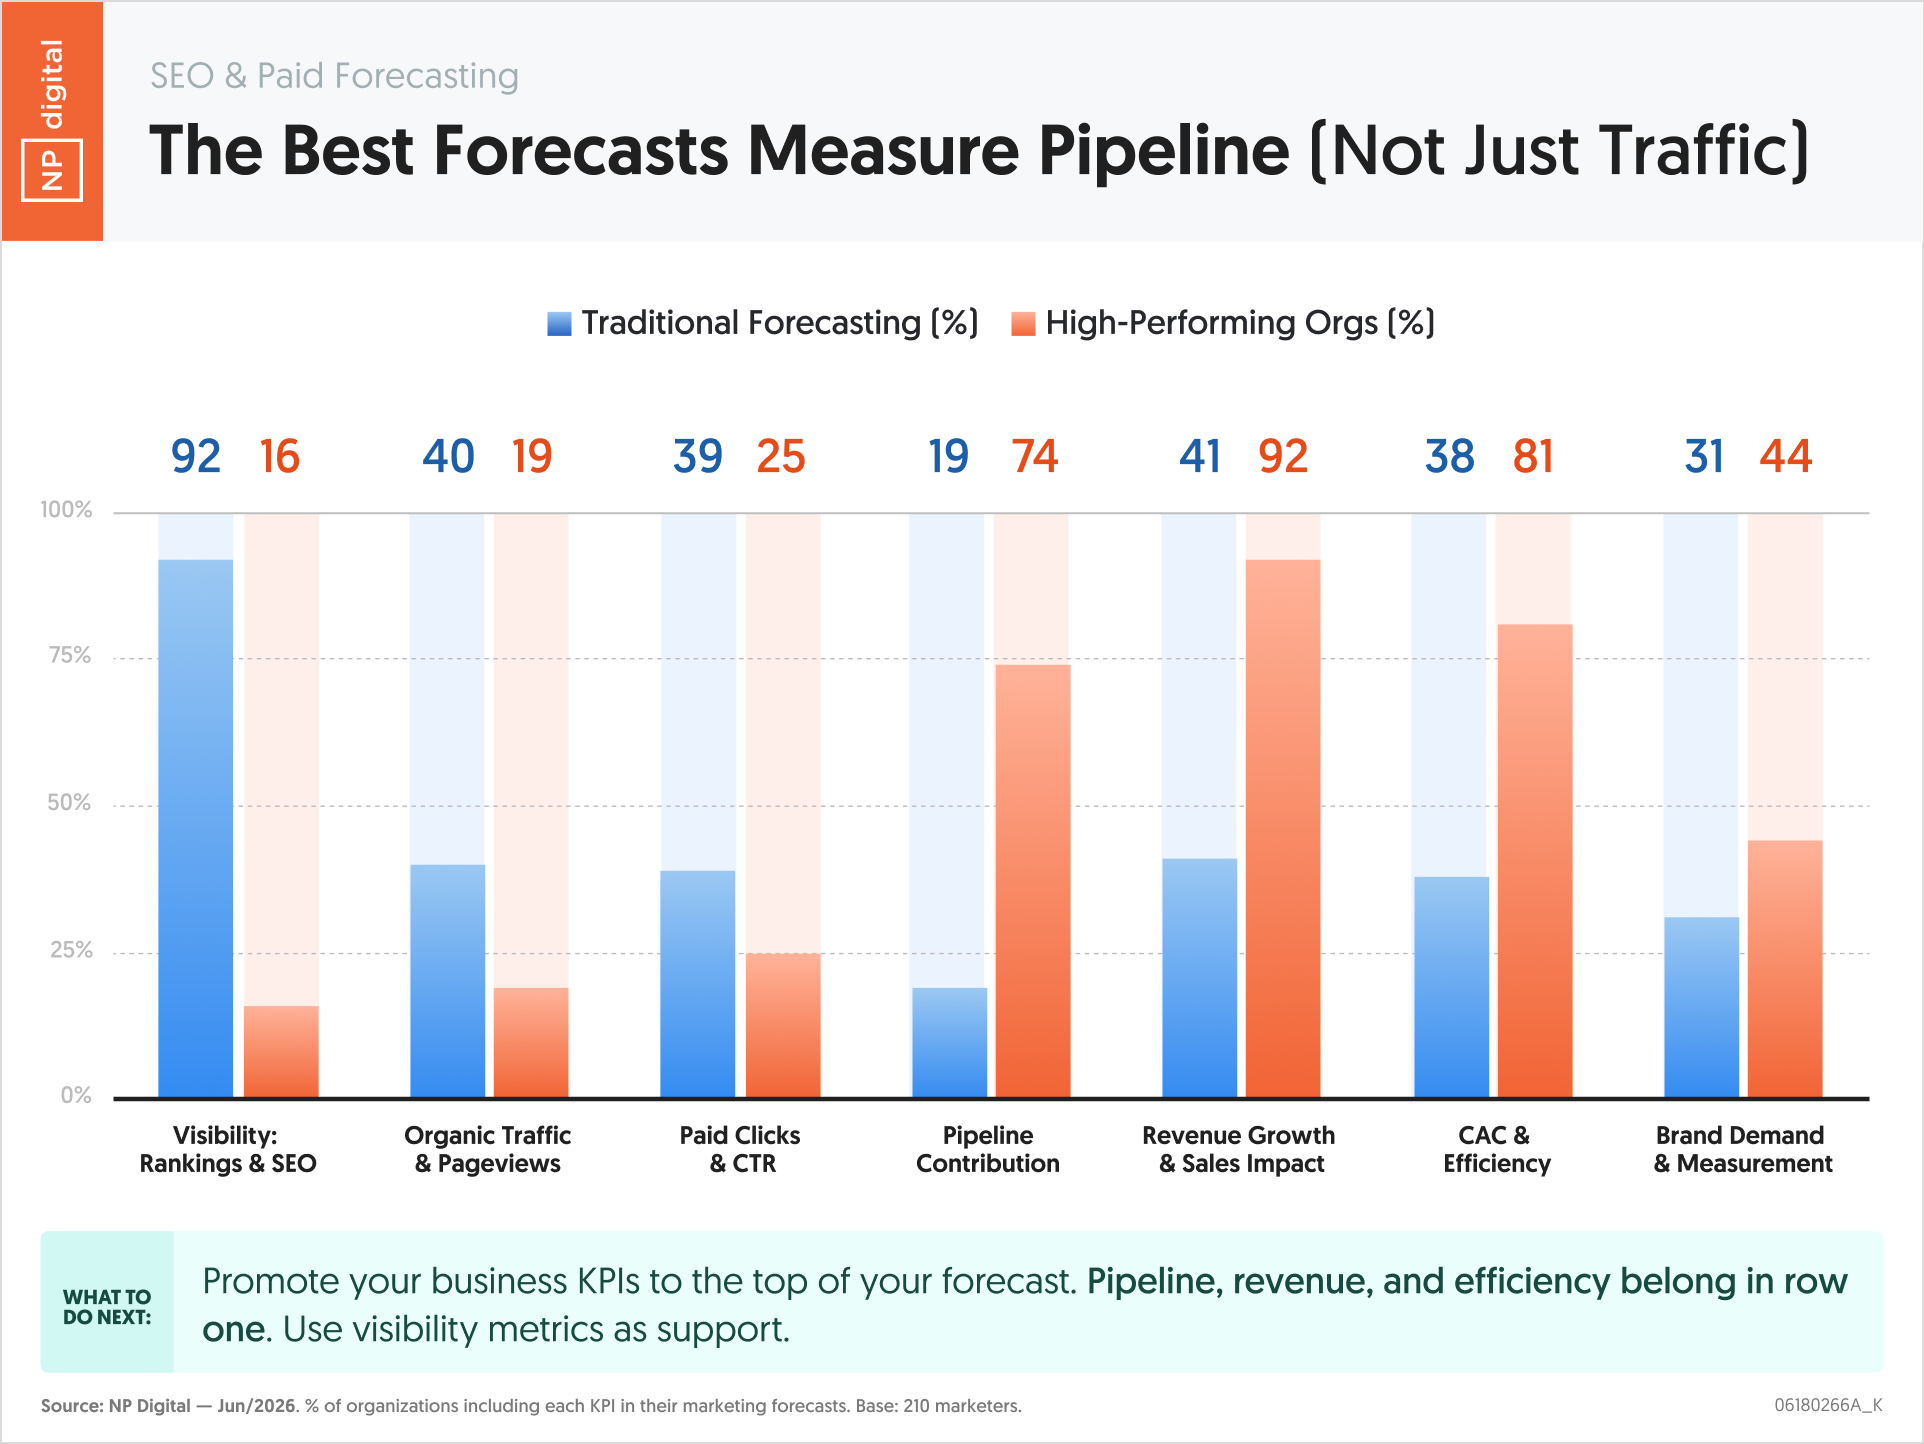
The KPIs in a marketing forecast reveal what the team believes marketing is for. Traditional forecasting concentrates on visibility metrics: rankings, traffic, clicks. High-performing organizations build their forecasts around business outcomes: pipeline, revenue, and acquisition efficiency. This chart maps the gap between what 210 marketers include in traditional forecasting versus what high-performing organizations measure, and the differences are large enough to represent a fundamentally different theory of marketing’s purpose.
Essential Statistics
- 92 percent of traditional forecasters include visibility metrics like rankings and SEO, compared to only 16 percent of high-performing organizations.
- Pipeline contribution is included by 74 percent of high-performing organizations compared to only 19 percent of traditional forecasters.
- Revenue growth and sales impact is included by 92 percent of high-performing organizations compared to 41 percent of traditional forecasters.
- CAC and efficiency metrics are included by 81 percent of high-performing organizations compared to 38 percent of traditional forecasters.
- Brand demand and measurement is included by 44 percent of high-performing organizations compared to 31 percent of traditional forecasters.
- The largest gap between traditional and high-performing forecasting is in pipeline contribution, where high performers lead by 55 percentage points.
Key Takeaways
- Traditional forecasting and high-performing forecasting measure different things. The 76-point gap in visibility metric inclusion, 92 percent traditional versus 16 percent high-performing, is not a minor preference difference. It reflects a fundamental divergence in what each type of organization believes marketing is accountable for.
- Pipeline contribution at a 55-point gap is the most commercially significant difference. High-performing organizations treat pipeline generation as a primary forecasting metric, which means their marketing teams are held accountable to sales outcomes, not just traffic delivery.
- The 51-point gap in revenue growth and sales impact confirms that high-performing organizations connect their marketing forecasts directly to P&L outcomes. This connection is what earns marketing teams budget credibility with finance and executive leadership.
- CAC and efficiency at a 43-point gap indicates that high performers treat cost per acquisition as a forecast input and output, not just a campaign retrospective metric. Building CAC into the forecast allows teams to model the revenue impact of efficiency improvements alongside raw growth projections.
- The organic traffic and pageview gap at 21 points shows that even traffic metrics are less central to high-performing forecasting. Traffic is context, not the headline. High performers include it as supporting data rather than as the primary forecast measure.
Actionable Insights
- Add pipeline contribution as a required line item in your next marketing forecast before any other metric changes. The gap between traditional and high-performing forecasting on this metric makes it the single highest-leverage change available. Even a rough pipeline attribution estimate is more useful to leadership than a precise traffic forecast because it answers the question they actually care about: what does marketing contribute to revenue?
- Remove visibility metrics from the top of your forecast and move them to a supporting appendix. At 92 percent traditional inclusion and 16 percent high-performing inclusion, rankings and SEO visibility metrics signal to leadership that marketing is measuring inputs rather than outputs. Repositioning those metrics as context rather than headline KPIs shifts the forecast narrative toward business accountability.
- Build a CAC line into your forecast model using your current blended customer acquisition cost as the baseline. The 43-point gap in CAC and efficiency inclusion means most traditional forecasters are missing the metric that connects marketing spend directly to revenue per customer. A CAC forecast that models efficiency improvements alongside growth projections gives finance a clearer picture of marketing ROI than traffic or ranking forecasts can provide.
- Set a 12-month target to move your forecast structure from traditional to high-performing using the gap data as your roadmap. The transition does not require changing your measurement infrastructure overnight. Start by adding pipeline and revenue lines to your existing forecast, even if the data feeding those lines is imprecise. Precision improves as attribution matures. The structural shift in what you measure is the first step.
- Use the high-performing organization benchmarks in this chart when presenting your forecast methodology to leadership for the first time. Framing your pipeline-focused forecast as the approach used by the highest-performing marketing organizations provides external validation that reduces internal resistance to metric changes. Leadership teams are more likely to adopt new forecasting frameworks when they are positioned as industry best practice rather than internal experiments.
“The gap between traditional and high-performing forecasting is not about sophistication. It is about accountability. Traditional forecasters measure what is easy to count: rankings, traffic, clicks. High-performing forecasters measure what leadership cares about: pipeline, revenue, efficiency. Closing that gap starts with changing what goes on row one of your forecast.” – Neil Patel