


Google Search Console (GSC) is one of my favorite tools for managing websites. It offers insanely valuable data that helps you monitor your site’s presence in Google and troubleshoot issues.
There’s one GSC feature that doesn’t get enough praise, though—the Crawl Stats report.
It’s hard to find but gives you tons of information about how Google crawls your website—information you can use to make sure the search giant indexes your site properly.
In this article, I’ll show you how to find the Crawl Stats report, make sense of it, and use it to improve your SEO efforts.
Key Takeaways
- Google Crawl Stats is a report in Google Search Console that shows you how Google has recently crawled your website.
- The Crawl Stats report tells you a lot about your site’s performance, including whether there are any server errors and how quickly pages load. It can also help you determine your SEO crawl budget.
- The report contains several charts and graphs that cover the:
- Number of crawl requests Google has made
- Total download size
- Average response time
- Host status
- Crawl responses
- File types
- Crawl purpose
- Googlebot Types
- Use the Crawl Stats report to identify and resolve crawl issues like bad server codes, 404 pages, and a low crawl budget.
- It’s possible to improve your SEO using Crawl Stats. You can use the reports to check and improve your site’s indexing, look for opportunities to increase performance, and measure the impact of technical SEO changes.
What Is Google Crawl Stats?
The Google Crawl report is a Google Search Console feature that shows how Googlebot has crawled your site over the past 90 days.

It contains a range of statistics that help you answer questions like:
- When was your site last crawled?
- How many crawl requests did Google make?
- What was the server’s response?
- How many issues did Googlebot encounter?
The Crawl Stats report can also help you troubleshoot indexing issues, such as pages disappearing from the search engine results pages (SERPs).
Not everyone needs to use the Crawl Stats report, though. Google says websites with more than 1,000 pages (like e-commerce stores) will find the information most valuable.
It’s also important to note that the Crawl Stats report includes data on most crawl requests but not all of them. If you’re looking at your server logs, for instance, you may find a discrepancy between your server logs and the Crawl Stats report.
Why Google Crawl Stats Matter for Your Website
Google’s ability to crawl your website tells you a lot about your site’s performance.
Crawl errors can signal serious issues like broken links, slow loading speeds, and other problems affecting your site’s Core Web Vitals. The Crawl Stats Report automatically flags these issues, which you can then investigate to see if they are part of a wider (and more serious) problem.
Because the report shows you which pages Googlebot crawls, it’s particularly valuable for owners of large sites managing their website crawl budget—the amount of time and resources Google dedicates to crawling your site.
By showing which pages Googlebot crawls and indexes and which it doesn’t, the Crawl Stats report helps identify when important pages (like product or category pages) are overlooked. From there, you can take targeted action to make sure Google includes those valuable pages in the SERPs.
How to Access and Run the Google Crawl Stats Report
It’s easy to miss the Google Crawl report because it’s hidden away in the Settings menu in the left-hand sidebar.
You can access it by clicking on Settings.

Scroll down to the Crawling section and click the OPEN REPORT link next to Crawl stats.

That’s it. You’ll see the Crawl Stats report on the next page.
How to Navigate the Google Crawl Stats Report
Google Search Console’s crawler report can be confusing when you first open it. There are plenty of graphs and charts that Google could do a better job of explaining.
But don’t worry. I’ll take you through each element below.
1. Total Crawl Requests
The total crawl requests graph shows the total number of times Google has crawled your site over a given period. It counts both successful and unsuccessful crawls.

2. Total Download Size
Total download size measures how much content Google downloads during the crawling process. A high average could suggest that a lot of data is being retrieved or that file sizes are large.

3. Average Response Time
The average response time is how long it takes your server to respond to Google’s request for a page’s content. A lower response time generally indicates a faster server, which can lead to faster crawling and indexing.

4. Host Status
The host status section shows which issues Google encountered with your robots.txt file, DNS resolution, and server connectivity. Green ticks means Google had no problems. If you see an exclamation mark, however, then Google hasn’t been able to crawl your site, or there’s some other potential problem. You can click into each section to see specific problems if any occurred.

5. Crawl Responses
The crawl responses report shows all the responses Googlebots receive when crawling your site. Each response is grouped by its codes (200, 301, 404, etc.) The percentage indicated to the right of each response represents the proportion of total crawl requests that result in each response type.

6. File Type
The file type report shows the different file types like images, JavaScript, and video, along with the percentage of each file type.

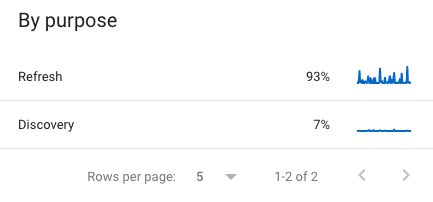
7. Crawl Purpose
Crawl purpose shows whether Google requested content it hasn’t indexed before (discovery) or requested content it already knows about (refresh).
8. Googlebot Type
The Googlebot Type chart shows which of Google’s crawlers access your site and how often they do so.

Identifying and Resolving Crawl Issues
Google’s Crawl Stats report is perfect for finding and fixing crawl issues like server errors, page errors, and problems with your crawling budget.
Server Issues
Server issues are some of the most serious, but they can also be hardest to solve. If you see a lot of 5XX responses in your crawl report, you’ll need to reach out to your hosting provider to see if there’s an issue or configuration stopping Google from crawling your site.
Page Errors
Page errors, like 404s, can negatively impact the user experience and reduce your SERP presence. Even the best-maintained sites will have 404 issues, but if your Crawl Stats report shows a lot of them, you’ll need to take action.
Download the list of 404 pages Google provides and set up 301 redirects to an appropriate alternative. If the page is trying to rank for a valuable keyword, consider re-creating the content.
Crawl Budget Issues
Finally, the Crawl Stats report can flag issues with your crawl budget. If you have huge swings in your crawl rate, hundreds of pages marked as crawled but not indexed, or low crawl rates relative to your site’s size, then you may have a budget issue.
You can fix this by making it easier to crawl your site. Try to create a flatter site hierarchy and add more internal links so that no page is more than three clicks from your home page. Fixing broken links and improving your site speed can also help.
Optimizing Your Site Based on Crawl Data
The Crawl Stats report doesn’t just help you identify and resolve technical crawl issues. It can also boost your optimization efforts.
For example, I can use the Crawl purpose report to see whether Google is indexing the new content I create. Most crawls will be refreshes, even if I create dozens of new pages each day. But if discovery crawls are very low (5 percent or less), then I’ll verify whether my sitemap is active and up to date.
I can also use the average response time report to identify issues with my site’s speed and usability. Slow average response times could mean Google is struggling to load my site’s content. That’s something I can explore further with a technical SEO audit.
If I make improvements to my site—like reducing image file sizes or minimizing CSS—I can even use the Crawl report to track the impact of my efforts. In this case, I should see a decrease in total download size since my files are smaller. The average response time should decrease, too.
FAQs
What is Google Crawl Stats report?
The Google Crawl Stats report is a Google Search Console feature that helps site owners, marketers, and developers understand how Google crawls their sites.
Where is the Crawl Stats report in Google Search Console?
The Crawl Stats report is located in the settings section of Google Search Console. Click on Settings in the left-hand sidebar, then scroll down to the Crawling section and click OPEN REPORT.
What does the crawl stats report show?
The Google Crawl Stats report shows how Googlebots have interacted with your site. It displays a range of metrics, including:
Crawl responses
Total crawl requests
Total download size
Average response time
Host status
How to check crawl budget in Google Search Console?
You can estimate your crawl budget by analyzing the average number of crawl requests Google makes each day in the Crawl Stats report. A higher average suggests Google is willing to crawl your site more frequently. Remember that many factors influence your crawl budget—not just request count.
Conclusion
The Crawl Stats report may seem rudimentary on the surface, but it tells you so much about your site’s performance and Google’s ability to crawl it.
Use the Crawl Report as part of your ongoing strategy and pinpoint problems with your site’s technical performance, optimize your site’s crawl budget, and supercharge your SEO return on investment (ROI).
This is just a taste of Google Search Console’s powers, though. GSC is a treasure trove of actionable information. Use it wisely and watch your website thrive.
Are You Using Google Ads? Try Our FREE Ads Grader!
Stop wasting money and unlock the hidden potential of your advertising.
- Discover the power of intentional advertising.
- Reach your ideal target audience.
- Maximize ad spend efficiency.