


Key Takeaways
- Customer engagement metrics reflect how your audience connects with your brand across marketing channels.
- Track engagement metrics throughout the customer journey to make smarter decisions about your marketing.
- Good engagement rates depend on several factors, so focus on finding what’s ideal and attainable for your brand first.
Are prospects even paying attention to your promotional content? Which ones are most likely to convert? And what makes your most loyal customers become advocates for your brand?
To answer these questions and understand how your audience interacts with your brand, you have to look beyond vanity metrics.
I’ll break down the engagement metrics you need to track at each stage of the customer journey — so you can build a successful brand and keep it on track toward sustainable growth.
What Are Customer Engagement Metrics and Why Do They Matter?
Engagement metrics are data points that reflect how prospects and customers show interest in your brand. They span touchpoints across your website, social media profiles, email marketing, and other channels.
The right metrics help you understand:
- Which marketing channels drive results, so you know how to allocate your budget
- Which customer segments perform best, so you know how to personalize your messaging
- How customers feel about your brand, so you can address the cause of any negative sentiment
- Where people tend to drop off in the customer journey, so you can find and address friction
- What really matters to customers, so you can make data-driven decisions about promotions
I recommend tracking specific engagement metrics at each stage of the customer journey.
This approach makes it easier to identify what’s working and what isn’t as customers go from awareness to advocacy.
The result?
You get the insights you need to build a better customer experience — and a brand that meets revenue, growth, and other critical business goals.
How to Track Engagement Metrics
The best tools depend on the marketing channel you need to measure.
If your marketing efforts span multiple channels, tools like Looker Studio help you visualize all your data. But if you’re focused on a single channel, native tools are often easier to manage.
- To evaluate website metrics, use a web analytics tool like Google Analytics.
- To check ad metrics, use Google Ads or native social media ad managers.
- To measure social media metrics, use native Meta, LinkedIn, or TikTok tools.
What’s Considered Good Customer Engagement?
Good engagement depends on factors like the channel, the industry, and the budget.
I recommend establishing benchmarks for your brand first.
Then, compare them against marketing benchmarks for your industry and channels and set engagement KPIs (key performance indicators) for your brand.
Awareness Stage Engagement Metrics
Awareness stage metrics reflect how prospects connect with your marketing as they first get to know your brand. This data shows how well your efforts attract attention and create interest in your products or services.
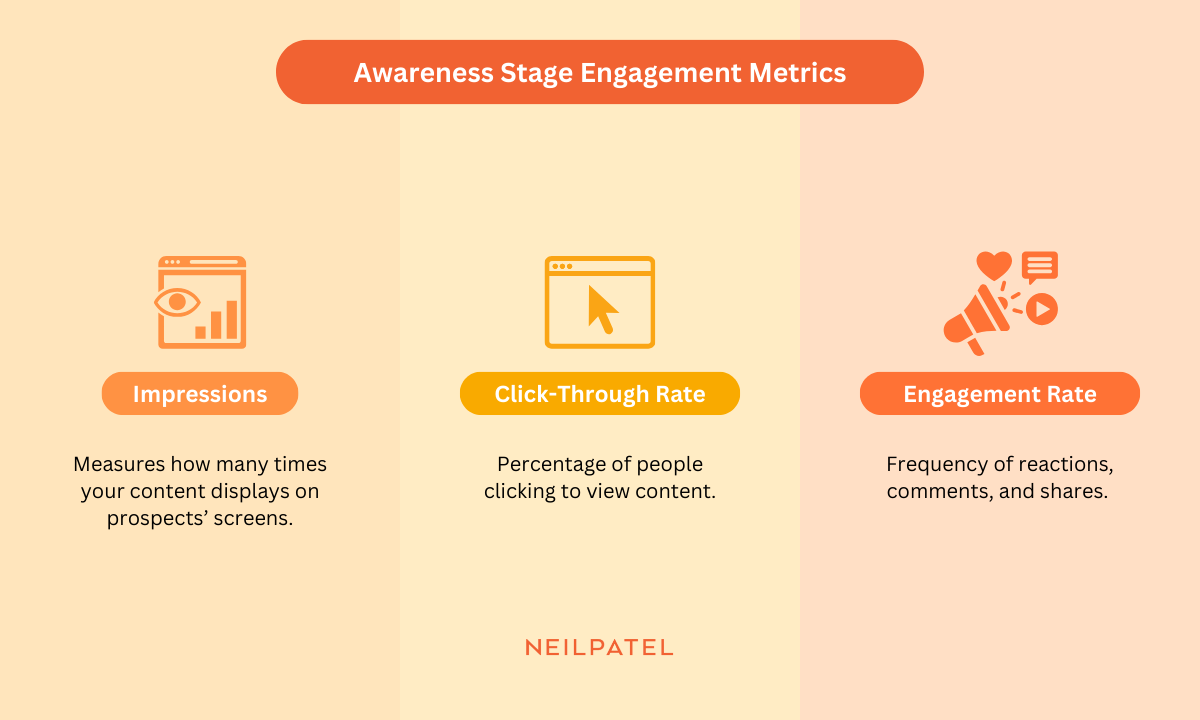
1. Impressions
Impressions measure the number of times your content displays on a potential customer’s screen.
It can tell you how many times people saw your LinkedIn post or ad in their feed. Or the number of times people saw your blog post in their Google search results.
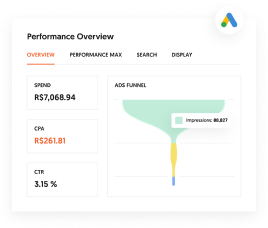
Are You Using Google Ads? Try Our FREE Ads Grader!
Stop wasting money and unlock the hidden potential of your advertising.
- Discover the power of intentional advertising.
- Reach your ideal target audience.
- Maximize ad spend efficiency.
It’s a crucial metric to measure visibility and confirm if your marketing content is actually reaching people.
I find it helpful to track impressions over time. When impressions increase month over month, your brand is successfully gaining visibility.
Are You Using Google Ads? Try Our FREE Ads Grader!
Stop wasting money and unlock the hidden potential of your advertising.
- Discover the power of intentional advertising.
- Reach your ideal target audience.
- Maximize ad spend efficiency.
2. Click-Through Rate
Click-through rate (CTR) is the percentage of people who click to view your content after seeing it in their feed or inbox.
Click-Through Rate = (Clicks / Impressions) x 100%
Similar to impressions, CTR applies to several marketing channels. It tells you if people are tapping the links in your emails. Or if they’re clicking on your posts in their organic or sponsored search results.
While impressions are a passive metric, CTR is an active engagement metric. It tells you if your marketing content is compelling enough to make people take the first step to engage with your brand.
3. Social Media Engagement Rate
Social media engagement rate shows how frequently people react to, comment on, or share your social media content.
Some marketers use social media analytics to measure engagement by impressions, while others base it on reach or followers.
I prefer impressions. But what’s most important is to choose one method for your social media data and stick with it.
Social Media Engagement Rate = (Total Engagement / Total Impressions) x 100%
This social media metric helps you track how effectively your content speaks to your audience — and if they care enough to leave a reaction, add a comment, or share with their own followers.
I recommend comparing impressions to engagement rate for each social media platform.
Say impressions are increasing but engagement rate is decreasing or staying the same.
This suggests that your visibility is growing but your marketing isn’t really speaking to your audience. So you need to create more engaging content.
Consideration Stage Engagement Metrics
Consideration stage metrics show how prospects interact as they learn about your brand and compare it against alternatives. They reflect how well your messaging and value proposition resonate with potential customers.
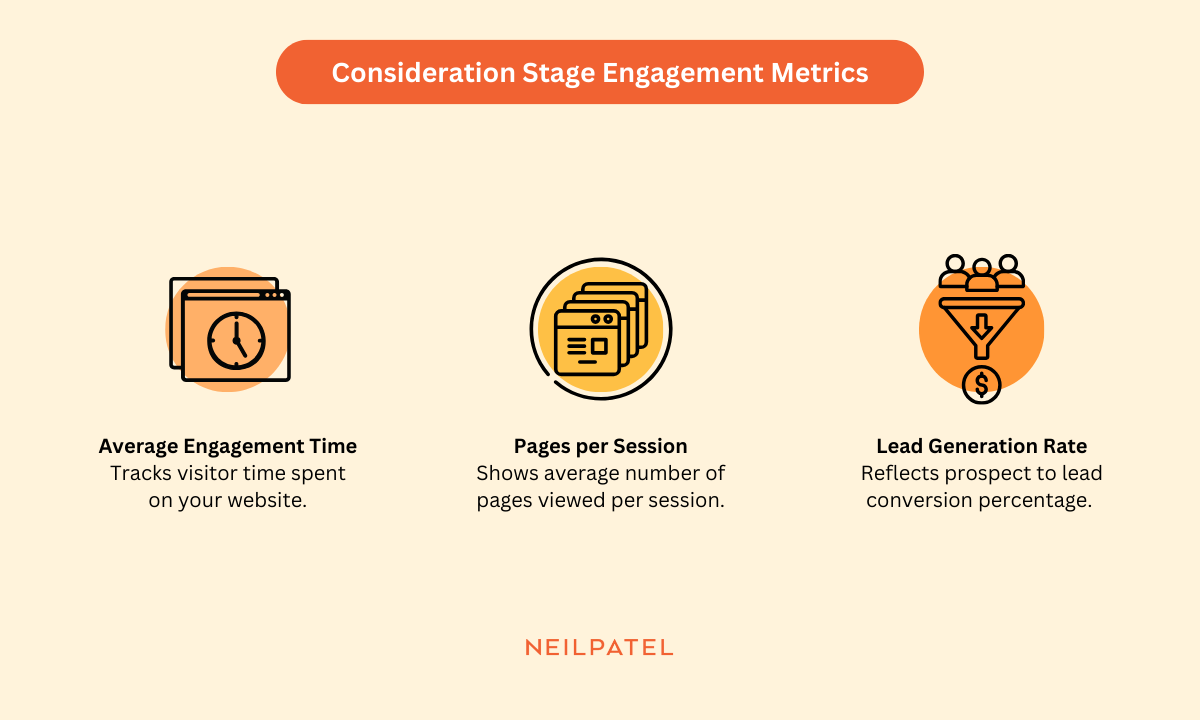
4. Average Engagement Time
Average engagement time tracks how long website visitors spend on your website during a given session.
Average Engagement Time = Total Session Duration / Number of Sessions
The longer people spend exploring your content, the more interested they generally are in your brand.
This often means they’re more deeply engaged. Which means they may be considering the next step, such as signing up or making a purchase.
I use Google Analytics to measure average engagement time and bounce rate — both of which are important website performance metrics.
With bounce rate, you see who isn’t engaged. A high bounce rate means a large percentage of people leave your site in less than 10 seconds or without viewing more than one page or triggering a key event.
5. Pages per Session
Pages per session shows the average number of pages people view on your site during a given session.
Pages per Session = Total Page Views / Total Number of Sessions
When pages per session are high, it typically means people find your brand’s content valuable.
It can also be a reflection of your team’s internal linking strategy. When you make it easy for people to navigate your site and discover new content, they’re more likely to visit additional pages.
Plus, the more pages potential customers visit, the more opportunities they have to convert.
6. Lead Generation Rate
Lead generation rate reflects the percentage of people (typically website visitors) who convert from prospects to leads.
Lead Generation Rate = (Total Leads Generated / Total Visitors) x 100%
Leads are people who opt to share their contact information with your brand. Usually, they do so in exchange for an incentive:
- B2B companies typically offer leads gated content, such as an original research report, an exclusive ebook, or a webinar invitation.
- B2C companies generally offer leads exclusive promotions and discount codes.
No matter the incentive, lead generation rate is a key metric for tracking progress through the customer journey. Once prospects become leads, they’re one step closer to becoming customers.
Decision Stage Engagement Metrics
Decision stage metrics reveal how prospects engage as they become customers and choose to invest in your brand. They show how well your conversion and sales processes work and can highlight points of friction.
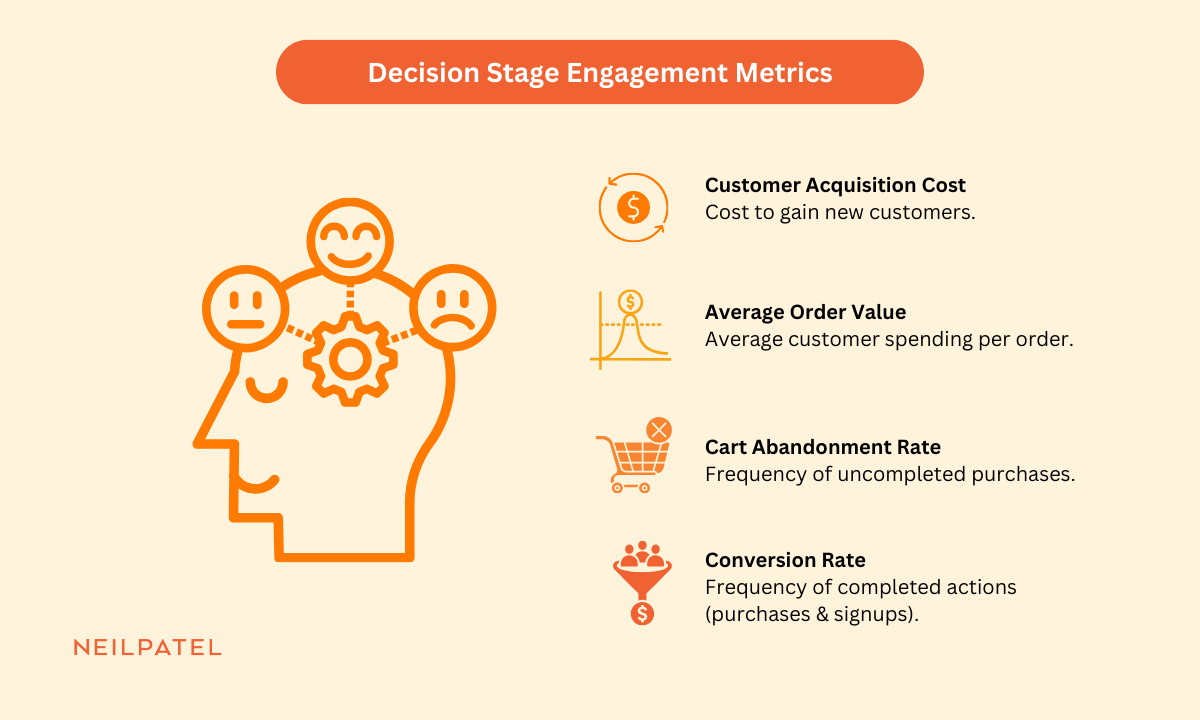
7. Conversion Rate
Conversion rate reflects the percentage of people who complete a specific action, such as a purchase or a signup.
Conversion Rate = Number of Conversions / Audience Size
In this formula, the way you measure audience size depends on the channel.
To measure conversion rate for a landing page, use the total number of page visitors. And for a social media post or ad, use the total number of impressions.
I recommend tracking conversion rate for every marketing campaign. This metric is a good indicator of how effective your marketing efforts are.
A high conversion rate means you’re reaching the right audience with the right offer. But a low conversion rate means you have room to optimize your offer, messaging, or targeting.
8. Cart Abandonment Rate
Cart abandonment rate measures the percentage of people who add items to their shopping cart but don’t complete their purchase.
Cart Abandonment Rate = (Number of Completed Purchases / Number of Carts Created) x 100%
It’s an important metric for identifying and addressing friction in your checkout flow.
High shopping cart abandonment may signal that customers are clicking away because:
- Your shipping fees are higher than expected.
- You don’t offer the payment method customers want to use.
- They just want to check out, not create an account on your website.
9. Average Order Value or Average Contract Value
Average order value (AOV) is the average amount customers spend when they buy from your business.
Average Order Value = Total Revenue / Total Number of Customer Orders
While AOV is an important ecommerce metric for B2C businesses, B2B companies often focus on average order value. The formula is similar:
Average Contract Value = Total Revenue / Total Number of Customer Contracts
Both of these metrics offer important insights into customer behavior.
Are customers spending more or less over time? Do they tend to bundle products or services together? Do they respond to your upsell or cross-sell offers?
These metrics also provide guidance for your marketing strategy. For example, you can identify your most valuable customer segments and refocus your marketing efforts on them to boost profitability.
10. Customer Acquisition Cost
Customer acquisition cost (CAC) reflects the average amount you spend on marketing and sales in order to gain a new customer.
Customer Acquisition Cost = Total Marketing and Sales Expenses / Number of Customers Acquired
CAC helps you assess how effective your marketing and sales strategies are at engaging and converting customers.
Typically, a lower CAC is better for revenue. But what’s most important is making sure the cost to acquire a customer stays below metrics like customer lifetime value, which I explain below.
Retention Stage Engagement Metrics
Retention stage metrics indicate how customers continue to respond to your brand after the initial purchase. They’re essential for evaluating customer relationships and measuring long-term value.
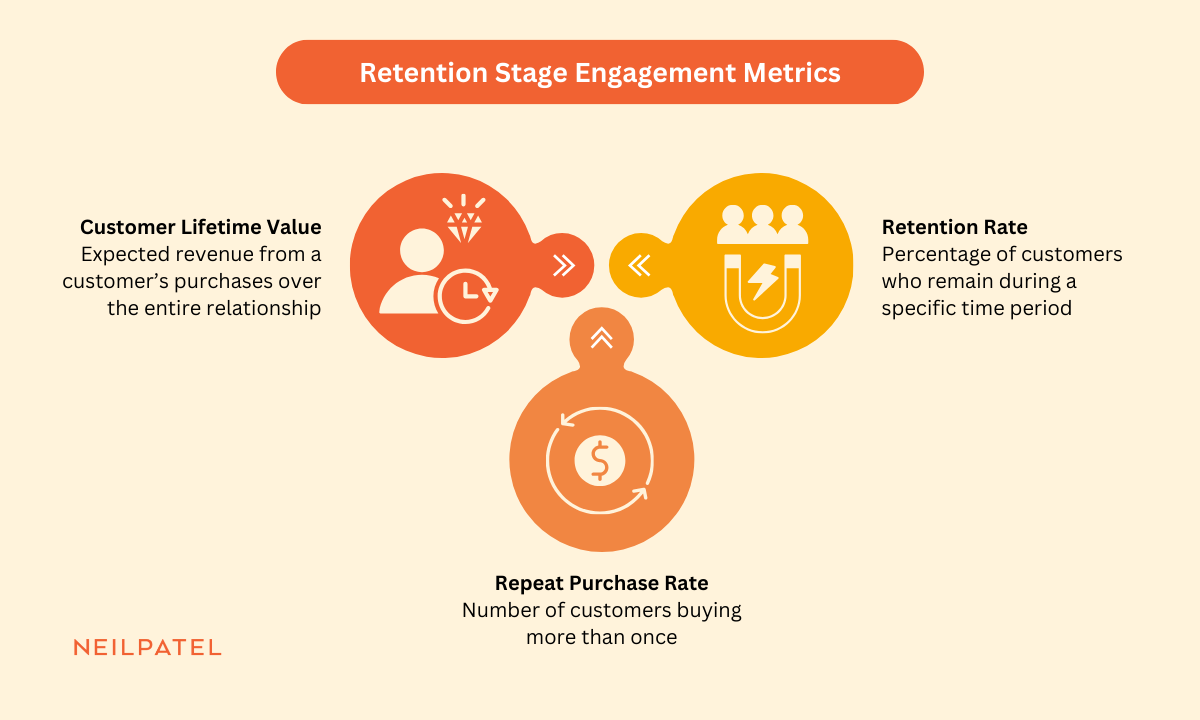
11. Retention Rate
Retention rate is the percentage of people who remain customers over a certain period of time.
Retention Rate = ((Number of Customers at End of Period – New Customers Acquired During Period) / Number of Customers at Start of Period) x 100%
It’s important for measuring customer engagement and satisfaction in the long term. A high retention rate usually signals excellent customer loyalty.
Plus, it helps you assess profitability and growth. A good customer retention rate often signals strong product-market fit. And it helps you forecast profit with more confidence.
I also find it helpful to track customer churn rate. This metric measures the customers you lose during a specific period, which can help you spot issues with engagement and product-market fit.
12. Repeat Purchase Rate
Repeat purchase rate measures the number of customers who buy from your business more than once.
Repeat Purchase Rate = Number of Customers with Repeat Purchases / Total Number of Customers) x 100%
It’s great for checking customer loyalty. And understanding how well your post-purchase experience works.
A high repeat purchase rate says customers have a good experience with your brand. Which can be a good indicator of future growth potential.
13. Customer Lifetime Value
Customer lifetime value (LTV) measures how much revenue your business can expect to earn from a customer from their first to their last purchase.
Customer Lifetime Value = Average Order Value x Number of Transactions x Average Customer Lifespan
It helps you gauge customer success and understand the value of their engagement. But it’s much more than that.
This metric is also crucial for forecasting resources, measuring profitability, and allocating resources.
I always recommend comparing LTV to CAC to make sure you aren’t overspending to acquire customers.
Advocacy Stage Engagement Metrics
Advocacy stage metrics demonstrate how customers support your brand as they become loyal buyers. They’re helpful for understanding customer satisfaction and measuring how customers fuel growth.
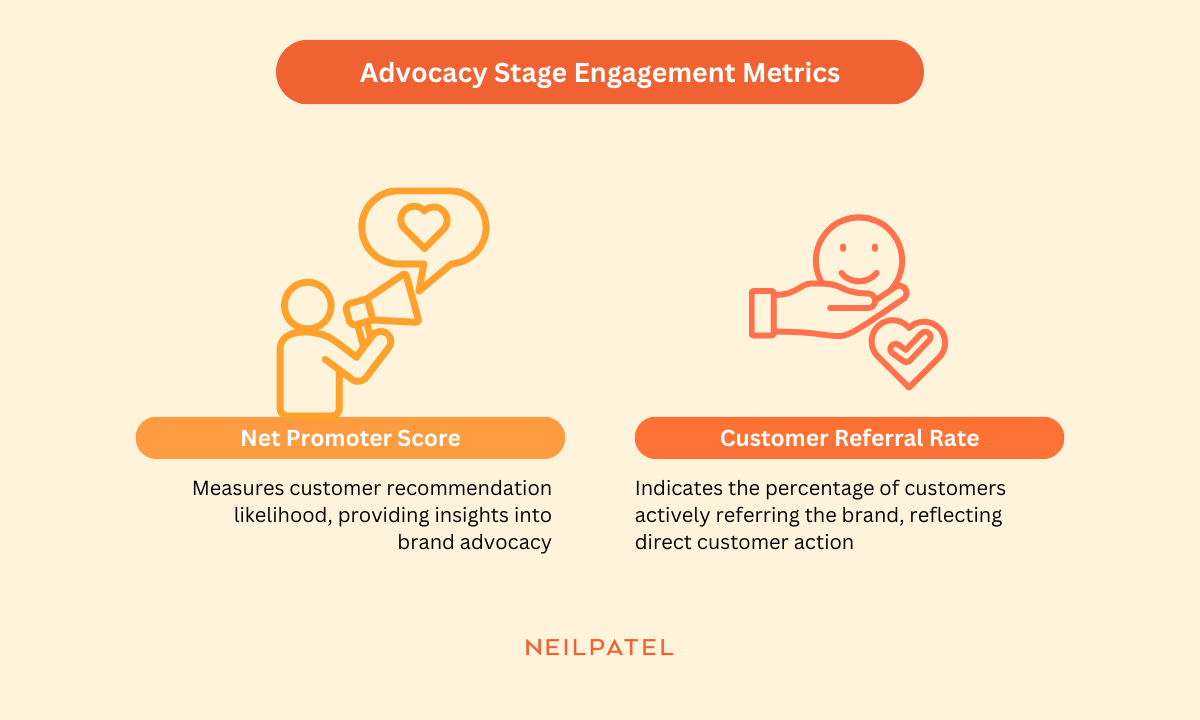
14. Net Promoter Score
Net promoter score (NPS) measures how likely customers are to recommend your brand to family, friends, or colleagues. It uses a customer feedback survey to develop a score on a scale of zero to 10:
- Promoters score the brand a nine or higher, showing that they’re engaged, loyal customers.
- Passives score the brand a seven or eight, indicating happy but somewhat unengaged customers.
- Detractors score the brand anywhere from a zero to a six, reflecting dissatisfied customers.
Net Promoter Score = Percentage of Promoters – Percentage of Detractors
Generally, any NPS above zero is considered decent, and above 50 is considered great. The higher this customer satisfaction score, the higher the likelihood that word-of-mouth marketing is working in your favor.
15. Customer Referral Rate
Customer referral rate is the percentage of customers who refer your brand to others.
Customer Referral Rate = (Referral-Making Customers / Total Customers) x 100%
Instead of surveying customers about the likelihood of recommending your brand, this metric measures their actual referrals. It shows how engaged customers are in advocating for your business.
FAQs
What are engagement metrics?
Engagement metrics measure how people interact with your brand across channels like your website, social media, email, and ads. They show how much attention your audience is giving you and how deep that connection runs. These metrics help you understand what’s working, what needs fixing, and how to drive more conversions at every stage of the customer journey.
How do you track engagement metrics?
It depends on the channel.
- Use Google Analytics for website engagement
- Use social media platform tools (like Meta Business Suite or LinkedIn Analytics) for post interactions
- Use email marketing platforms for open and click rates
- Use Looker Studio or other dashboards to bring it all together
Start by defining which metrics matter most to your goals, then track them consistently so you can spot trends and improve performance.
Which metrics drive engagement?
The most important engagement metrics vary by funnel stage, but some key ones include:
- Click-through rate (CTR)
- Average engagement time
- Conversion rate
- Net promoter score (NPS)
- Social media engagement rate
Focus on the ones that tell you how users are moving, clicking, converting, and sticking around. That’s how you know your content and campaigns are actually doing their job.
Conclusion
Tracking the engagement metrics that matter to your business is the key to sustainable growth.
These 15 metrics offer helpful insights into how your audience connects with your brand at every stage of their journey. Monitor them consistently to learn what’s working and what needs work so you can attract an engaged customer base that drives the results your business needs.