

Key Takeaways
- Ecommerce retailers should track a mix of revenue, conversion, acquisition, and product metrics.
- Identifying the metrics that align with your business goals is key to growing your ecommerce store.
- Monitoring key metrics on a regular schedule helps you spot problems and track progress.
Successful online stores know their numbers. They monitor ecommerce metrics for everything from product sales to customer behavior to website optimization.
But take one look at your Google Analytics or ecommerce platform dashboard, and you’re likely to get overwhelmed by all the data.
Which numbers really matter? I put together a list of 25 ecommerce metrics you should be tracking to grow your online store and turn data into revenue.
What Are Ecommerce Metrics?
Ecommerce metrics are measurements that reveal how your online store is performing.
They offer insight into everything from acquisition to conversions to revenue. The right metrics also measure customer satisfaction and marketing campaigns so you know what’s working and what needs improvement.
Which Ecommerce Metrics Should You Measure?
Below, I’ve broken down the 25 most important metrics for ecommerce sites to measure. But not every online store needs to track every single one of these indicators.
To start tracking the right ecommerce metrics for your business, get clear on your goals. Do you want to connect with more potential customers, increase your sales conversion rate, or improve your customer retention rate?
Then, decide how many metrics you can realistically track and optimize.
If you have a small team with limited resources, I recommend limiting yourself to five key metrics. Larger teams can often juggle more metrics and do deeper dives into customer segments or marketing channels.
How Often Should You Check Ecommerce Metrics?
I separate ecommerce metrics into three reporting dashboards: weekly, monthly, and quarterly.
- Check conversion rates, revenue, and marketing metrics weekly. If any of these metrics changes dramatically, you can address it before it becomes more expensive to fix.
- Track website traffic, shopping card abandonment, and lifetime value metrics monthly. These indicators tend to change more slowly, giving you a bigger picture view of your ecommerce site’s health.
- Review customer retention, satisfaction, and revenue growth metrics quarterly. I find it helpful to use this data to guide strategic planning and marketing budgets.
25 Essential Ecommerce Metrics
Use these metrics to measure the health of your ecommerce website and the success of your marketing campaigns.
Acquisition Metrics
Acquisition metrics reveal how effectively your online store attracts new customers.
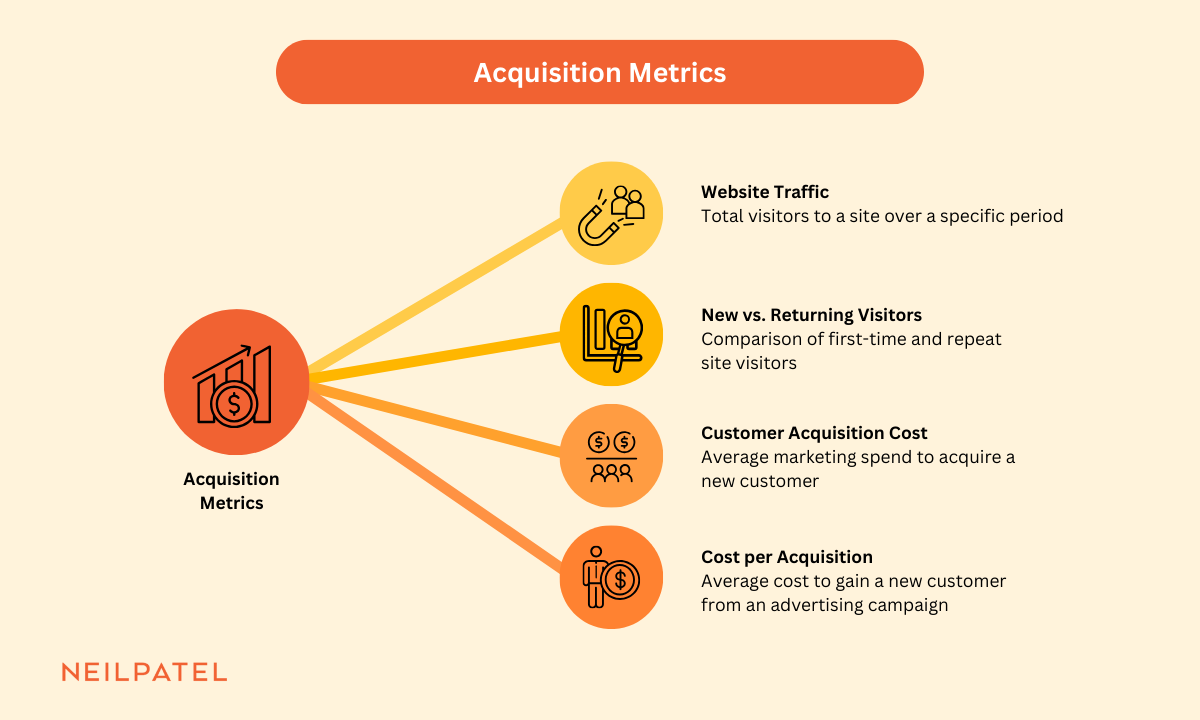
1. Website Traffic
Website traffic refers to the total number of visitors on your site during a certain time period.
To acquire customers and generate sales, you need prospects to visit your site. By tracking traffic metrics with a website analytics tool like Google Analytics, you can see if your site is successfully attracting potential shoppers.
Most ecommerce businesses ideally want more traffic over time. But it’s more important to understand the reason behind any fluctuations.
- Increases typically mean you’re attracting more potential customers
- Spikes indicate a sudden surge of interest from a promotion or mention
- Decreases may reflect an issue with marketing and advertising channels or campaigns
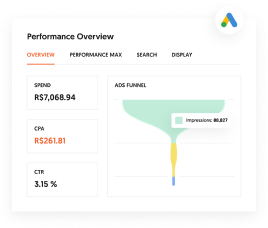
Are You Using Google Ads? Try Our FREE Ads Grader!
Stop wasting money and unlock the hidden potential of your advertising.
- Discover the power of intentional advertising.
- Reach your ideal target audience.
- Maximize ad spend efficiency.
2. New vs. Returning Visitors
Website visitors can either be new (arriving on your site for the first time) or returning (visiting your site again to browse or buy).
Are You Using Google Ads? Try Our FREE Ads Grader!
Stop wasting money and unlock the hidden potential of your advertising.
- Discover the power of intentional advertising.
- Reach your ideal target audience.
- Maximize ad spend efficiency.
Monitoring different types of visitors helps you understand the effect of your marketing efforts:
- More new visitors usually means you’re successfully promoting your business via paid or organic campaigns
- More return visitors generally means you’re successfully encouraging customers to seriously consider an item or make another purchase
Use Google Analytics to track this data and confirm that the balance of new versus returning visitors aligns with your goals.
If you want to expand your customer base, aim for more new visitors. If you want to build a loyal customer base for your product or service, target more returning visitors.
3. Customer Acquisition Cost
Customer acquisition cost (CAC) is the average amount you spend on marketing to gain a new customer.
Customer Acquisition Cost = Marketing Spend / Number of New Customers
CAC is an essential metric to track for your profit margin.
For your ecommerce business to earn a profit, your CAC has to be lower than the average revenue a customer generates over the course of the relationship. That’s why I recommend comparing it to customer lifetime value.
4. Cost per Acquisition
Cost per acquisition (CPA) is the average amount you spend to gain a new customer from an advertising campaign. While CAC factors in all marketing efforts, CPA applies to a specific ad campaign.
Cost per Acquisition = Campaign Cost / Number of New Customers
It’s a key ecommerce metric for a couple of reasons. It helps you:
- Make sure the amount you spend to acquire new customers doesn’t outweigh the revenue they generate
- Identify your best and worst performing ad campaigns so you can adjust your ad strategy
Conversion Metrics
Conversion metrics reflect how efficiently your ecommerce site turns visitors into customers.
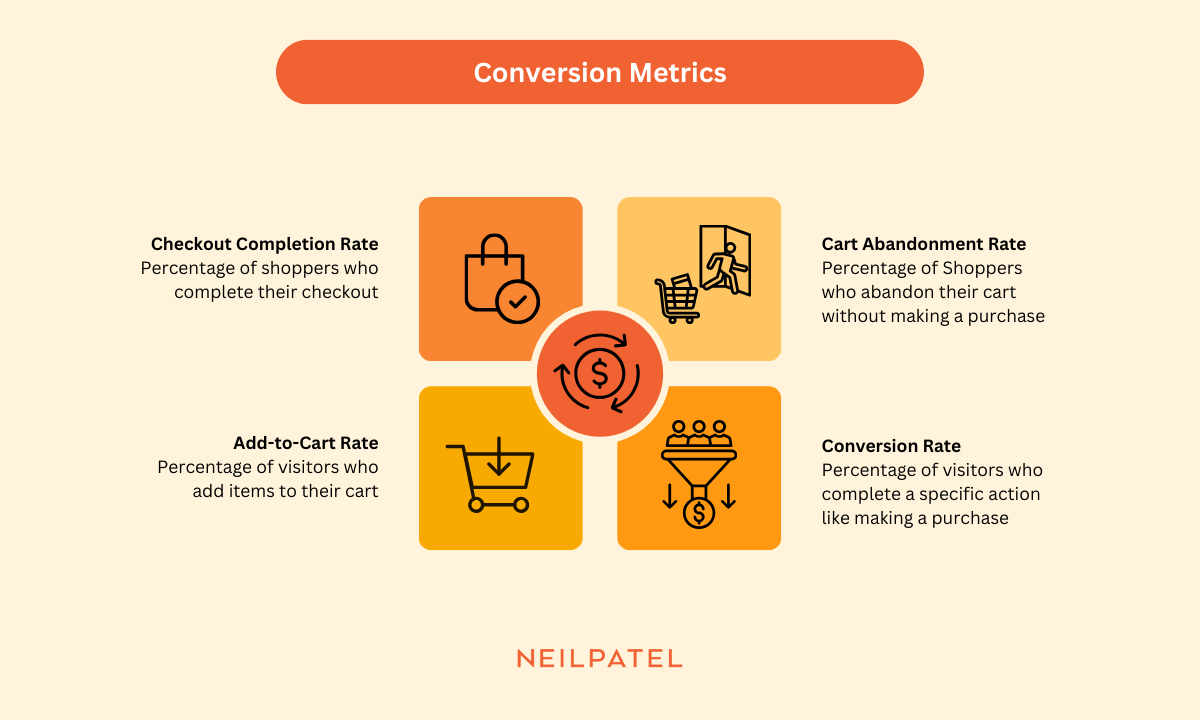
5. Conversion Rate
Conversion rate is the percentage of visitors who complete a specific action. For an ecommerce website, it typically refers to the percentage of people who make a purchase.
Conversion Rate = Number of Conversions / Number of Website Visitors
It’s an important metric for understanding how much site traffic you need to reach your ecommerce sales goals.
Say your conversion rate is 10%. And you need to get 100 sales conversions. You can reverse engineer the formula above to confirm that you need to attract 1,000 website visitors to meet your goals (10% = 1,000 / 100).
6. Add-to-Cart Rate
Add-to-cart rate is the percentage of visitors who add at least one item to their shopping cart.
Add-to-Cart Rate = Number of Website Sessions With Add-to-Cart Events / Total Website Sessions
If your conversion rate is low, checking your add-to-cart rate can help you diagnose the problem.
If your add-to-cart rate is also low, it indicates that customers aren’t seriously considering a purchase. Optimizing your landing page or reconsidering your value proposition can help.
7. Cart Abandonment Rate
Cart abandonment rate is the percentage of shoppers who add items to their cart but never finish checking out.
Cart Abandonment Rate = 1 – (Completed Purchases / Shopping Carts Created)
Similar to your add-to-cart rate, your cart abandonment rate gives you more insight into the shopping process.
A low shopping cart abandonment rate means your average customer journey is relatively efficient. Shoppers can visit your website and check out with minimal friction, creating a positive customer experience.
But a high rate means something might be preventing customers from purchasing from your ecommerce store. To lower it, I often recommend testing email follow-ups, retargeting campaigns, and time-sensitive offers.
8. Checkout Completion Rate
Checkout completion rate is the percentage of shoppers who start and finish a checkout.
Checkout Completion Rate = Number of Completed Purchases / Number of Checkouts Started
If this rate is high, customers are successfully completing the last step in the purchase process. But if this rate is low, you should look for points of friction to address.
For example, you might eliminate unnecessary steps in the checkout process or optimize this flow for mobile users.
Revenue Metrics
Revenue metrics reflect the financial performance and profitability of your online store.
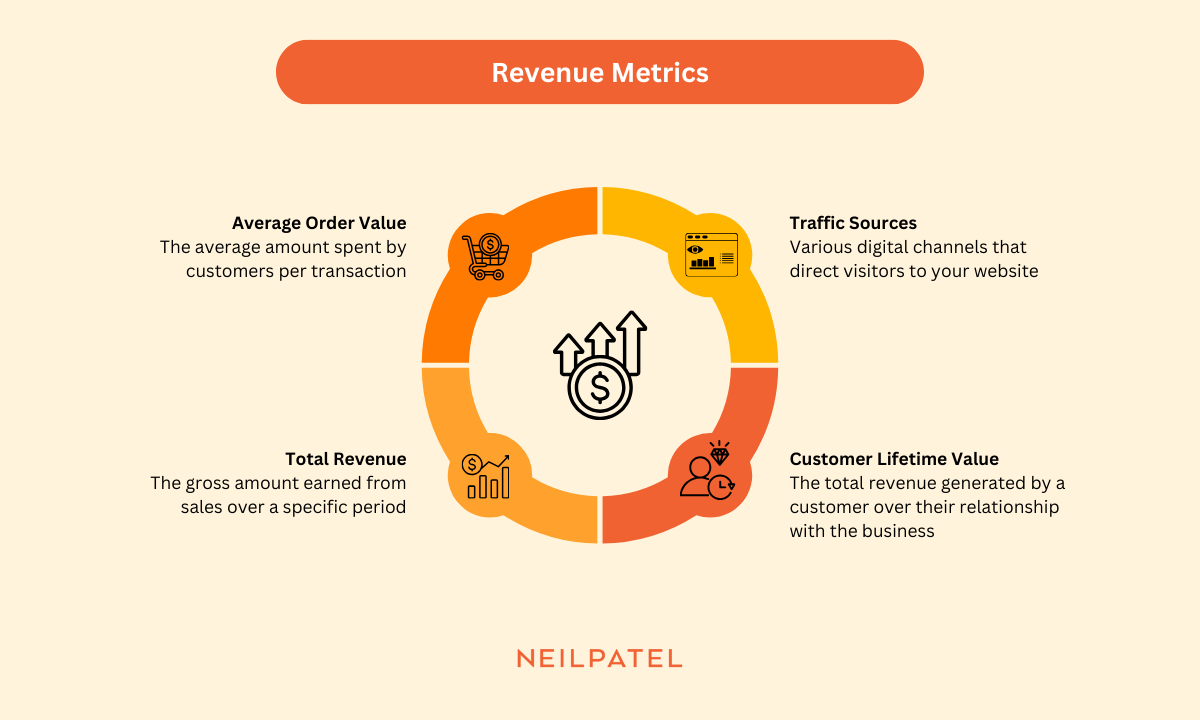
9. Total Revenue
Total revenue is the gross amount your ecommerce business earns from sales during a specific period.
It’s a basic ecommerce metric for assessing the health of your business. Naturally, you need to hit certain revenue levels to meet your profit goals.
Plus, I always recommend tracking total revenue over time. This helps you identify seasonal changes and fluctuations in campaign performance.
For more insight into total revenue, compare it to the other revenue metrics below.
10. Average Order Value
Average order value (AOV) is the average amount a customer spends on each online store transaction.
Average Order Value = Total Revenue / Total Number of Orders
The higher your AOV, the lower the number of customers you need to reach revenue goals. Which means you may be able to spend less on new customer acquisition while maintaining your profit margin.
To increase this sales metric, try tactics like offering discounts on larger purchases. Or use upselling and cross-selling strategies to get customers to upgrade their purchases or buy more items.
11. Revenue per Visitor
Revenue per visitor is the average amount of money each website visitor generates.
Revenue per Visitor = Total Revenue / Total Number of Visitors
When you know this metric, you get a better idea of the total number of website visitors you need to reach your revenue goals.
If you find that you’re falling short of those key performance indicators (KPIs), you have a couple of options:
- Improve your conversion rate by optimizing your checkout process and product pages
- Increase your AOV by offering bulk specials and using cross-selling or upselling tactics
12. Customer Lifetime Value
Customer lifetime value (LTV) is the total amount of revenue a typical customer generates over the course of their relationship with your business.
Customer Lifetime Value = Average Order Value x Purchase Frequency x Average Customer Lifespan
When you can gauge the value of a customer, you can make more informed decisions about how much to spend on CAC. A good LTV to CAC ratio is 3:1, meaning you earn $3 for every $1 you spend to acquire a new customer.
If your LTV is too low compared to your CAC, tactics like loyalty programs and subscription models can help.
Product Metrics
Product metrics show how ecommerce items perform in terms of sales and returns.
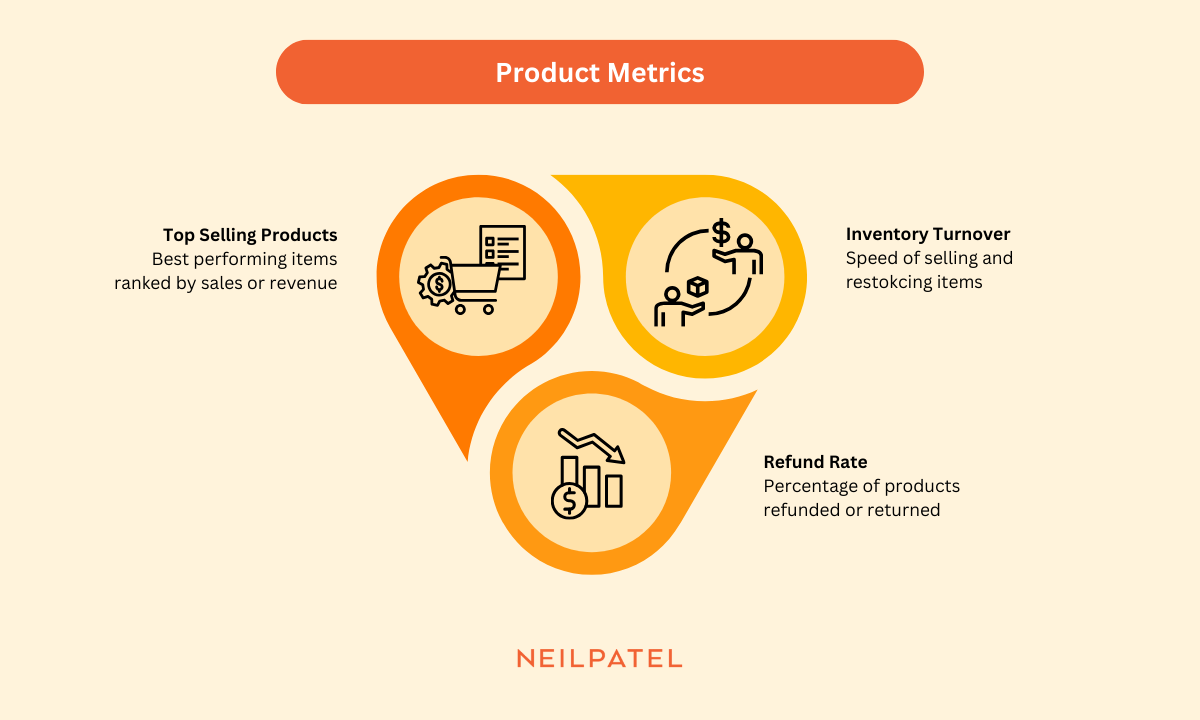
13. Top Selling Products
Top selling products are the best performing items in your online store ranked by sales or revenue. Check your ecommerce platform for a list of products by total number of sales or revenue.
When you know which items drive most of your sales or revenue, you can better allocate marketing budget. Plus, you can prioritize inventory management for these items and make sure they’re always available for sale.
14. Refund or Return Rate
Refund or return rate is the percentage of products that customers refund or return.
Refund Rate = Number of Products Refunded / Number of Products Sold
This metric helps you assess both customer satisfaction and product quality. The higher your refund rate, the more frustrated customers are likely to be.
To lower this rate, make a point of asking customers about the reason for their return. Then, take action based on their response. For example, the sizing might be inaccurate or the product description might need extra detail.
15. Inventory Turnover Rate
Inventory turnover rate is the speed at which you sell and restock items in your online store.
Inventory Turnover Rate = Cost of Goods Sold / Average Inventory Value
This ecommerce metric tells you how efficiently you’re cycling through your inventory. A higher rate indicates stronger sales, while a lower rate means sales are slow or you’ve overstocked.
To improve inventory turnover rate, promote items that sell slowly or include them in your cross-selling strategy. Then, use your ecommerce analytics to better anticipate inventory needs and sales patterns.
Customer Metrics
Customer metrics reveal how shoppers feel about your company and products.
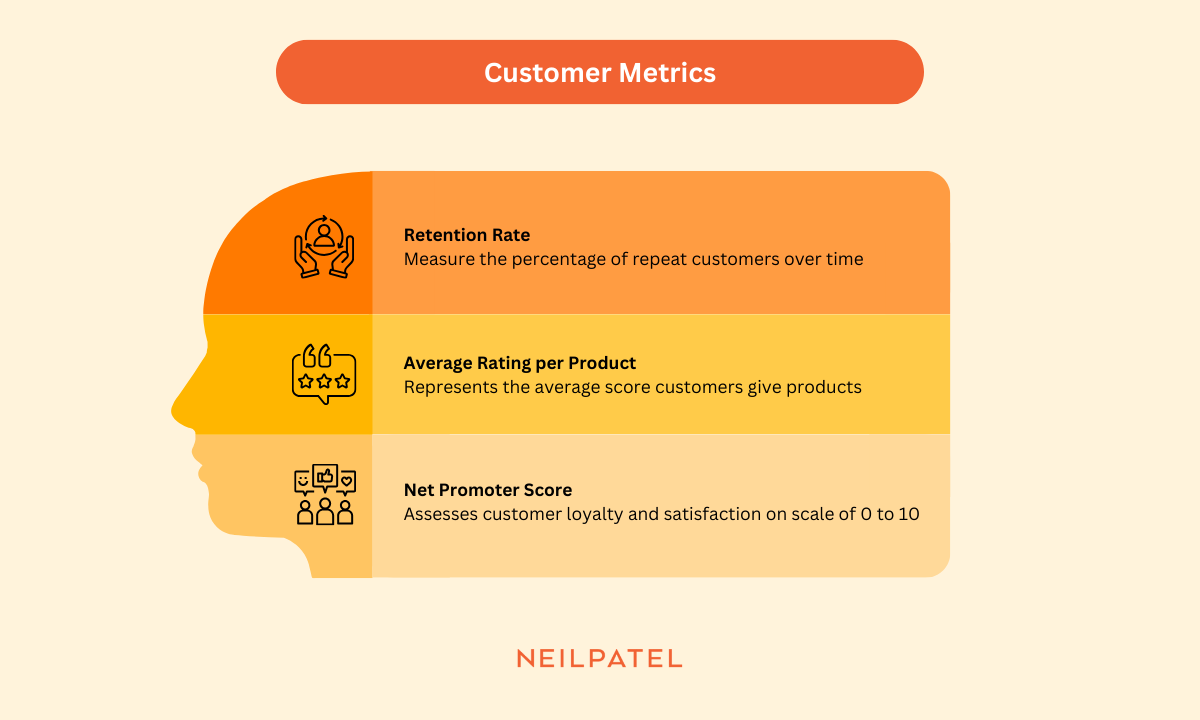
16. Retention Rate
Retention rate is the percentage of customers who make repeat purchases from your online store over a certain time period.
Retention Rate = (Number of Customers at the End of the Period – Number of New Customers Acquired During the Period) / Number of Customers at the Start of the Period
It’s an important ecommerce metric to track for the long-term profitability of your business.
I’ve found tactics like offering subscription models, setting up loyalty programs, and creating personalized marketing campaigns to be most helpful for boosting retention rates.
17. Average Rating per Product
Average rating per product is the average score that customers give an ecommerce product.
Average Rating per Product = Total of All Ratings for a Product / Total Number of Ratings for the Product
A higher average rating typically means happier customers. Which can translate to more repeat shoppers and a better retention rate.
To improve the average rating for your products, pay attention to your customer reviews. Make note of the negative issues they raise and make a plan to address the biggest or most common problems.
18. Net Promoter Score
Net promoter score (NPS) measures customer loyalty and satisfaction via a simple survey.
It asks customers how likely they are to recommend your business to friends or family on a scale of zero to 10. Then, it groups responses into three categories:
- Promoters (9-10): Loyal customers
- Passives (7-8): Satisfied customers
- Detractors (0-6): Unhappy customers
To calculate NPS for your online store, determine the percentage of customers in each group.
Net Promoter Score = % of Promoters – % of Detractors
When you send this survey to customers, ask additional questions. The more you know about the reason for their rating or what they like and dislike about your business, the easier time you’ll have making improvements.
Website Metrics
Website metrics show how visitors find and interact with your ecommerce site.
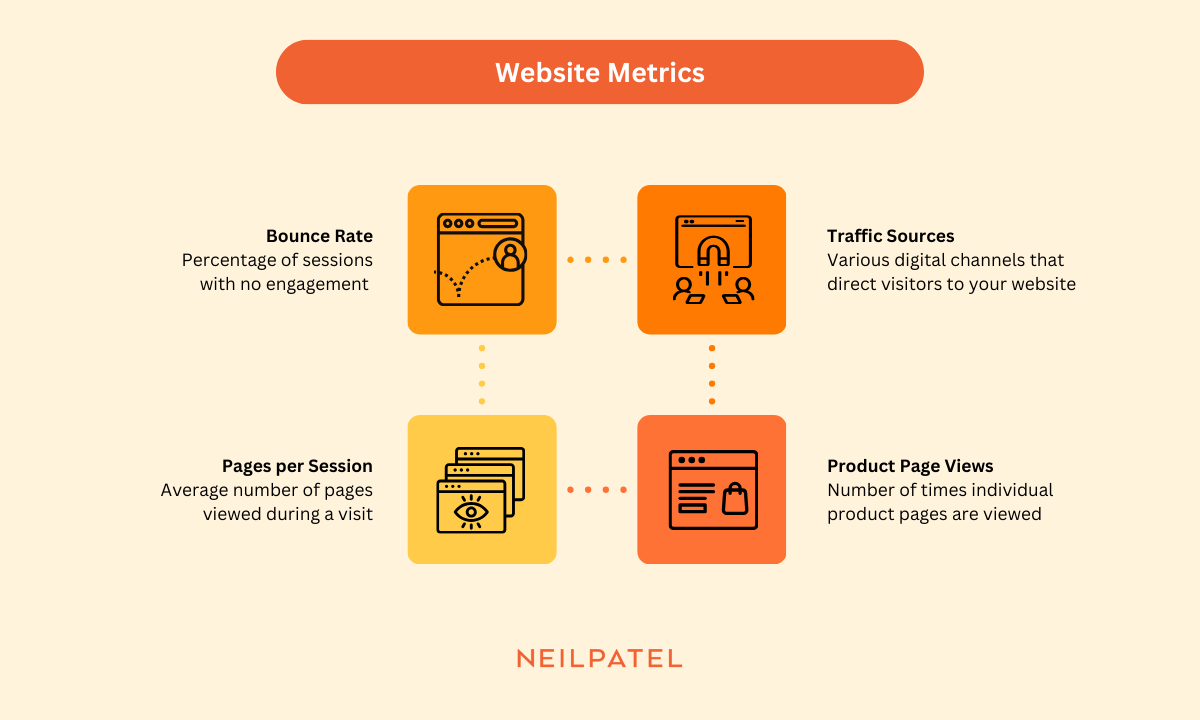
19. Traffic Sources
Traffic sources are the various digital channels that funnel visitors to your website.
Depending on the marketing channels your business uses, your traffic sources might include organic search, social media, email campaigns, paid ads, and others. Your Google Analytics dashboard displays these sources.
By tracking where your website traffic comes from, you learn more about which channels drive the most traffic for your brand — and which are worth an additional investment.
For deeper insights, I suggest segmenting visitors by traffic source and then review the other site metrics below.
20. Product Page Views
Product page views is the number of times visitors view each individual product page.
It helps you understand customer behavior, including interest levels in certain products.
Plus, it helps you gauge product performance. Products with low page views might benefit from more prominent placements on your website or more effective promotions.
21. Pages per Session
Pages per session is the average number of pages a potential customer views during a visit to your website.
Website metrics like pages per session help you assess engagement and get more insight into the shopping experience. The more pages a visitor browses, the higher their engagement tends to be.
To improve this engagement metric, identify where visitors drop off. Then, use ecommerce conversion optimization tactics to increase engagement and drive more conversions.
22. Bounce Rate
Bounce rate is the percentage of website sessions that aren’t engaged. It includes sessions that last 10 seconds or less, include just one page view, or lack a conversion event.
A high bounce rate usually indicates low interest in your products or brand or a poor user experience on your site. No matter the cause, it often means a low conversion rate.
To improve your bounce rate, resolve technical issues on your site and pay attention to relevance. Ideally, your site content will meet the expectations of anyone clicking through from a social media post, email, or ad.
Marketing Metrics
Marketing metrics reveal campaign performance and help you improve your marketing strategy.
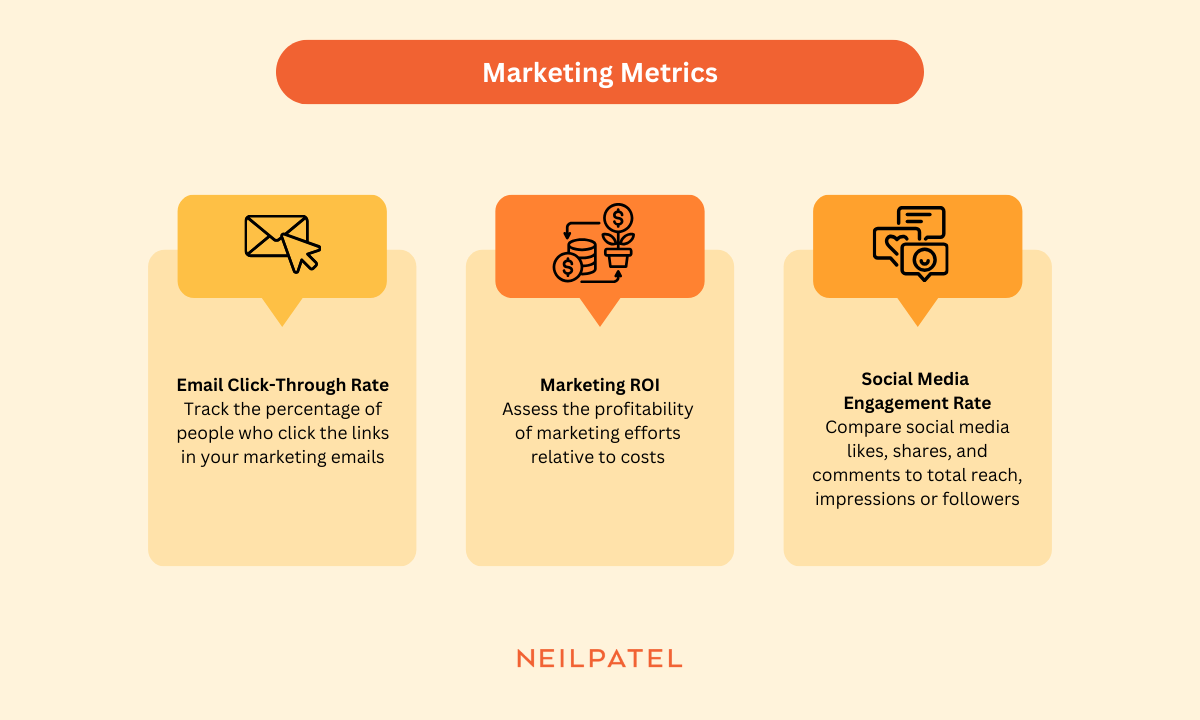
23. Email Click-Through Rate
Email click-through rate (CTR) is the percentage of people who click the links you include in marketing emails.
Email Click-Through Rate = Total Clicks / Total Emails Delivered
The higher your CTR, the more potential customers you drive to your site. To increase your CTR, focus on improving your email marketing strategy by sharing relevant content and time-sensitive offers.
24. Social Media Engagement Rate
Social media engagement rate compares likes, shares, and comments to total reach, impressions, or followers.
Social Media Engagement Rate = Total Engagement / Total Reach, Impressions, or Followers
This social media metric is key to understanding how well potential customers respond to your marketing.
But it doesn’t always align with conversions. I recommend reviewing this metric and traffic sources side by side to see how social media engagement contributes to clicks and purchases.
25. Marketing Return on Investment
Marketing return on investment (ROI) is a metric that compares the profitability of your efforts to the cost.
Marketing ROI = (Revenue from Marketing / Marketing Costs) / Marketing Costs
It reveals how effective your marketing efforts are, making it easier to understand which campaigns and channels are working and where to invest more of your budget.
FAQs
What are e-commerce metrics?
E-commerce metrics are the key measurements that show how your online store is performing. They track everything from traffic and conversions to revenue, customer behavior, and product performance. By focusing on the right metrics, you can see what’s working, spot problems early, and make smarter decisions to grow sales.
What e-commerce metrics should you track?
The most important e-commerce metrics to track depend on your goals, but most businesses should monitor:
- Acquisition metrics like website traffic, customer acquisition cost (CAC), and cost per acquisition (CPA)
- Conversion metrics like conversion rate, add-to-cart rate, cart abandonment, and checkout completion
- Revenue metrics like total revenue, average order value (AOV), and customer lifetime value (LTV)
- Product metrics like top-selling items, return rate, and inventory turnover
- Customer metrics like retention rate, average product rating, and Net Promoter Score (NPS)
- Website metrics like bounce rate, traffic sources, and pages per session
- Marketing metrics like email click-through rate, social engagement, and marketing ROI
Tracking a mix of these gives you a clear picture of store health and where to optimize for growth.
Conclusion
Monitoring these metrics regularly (weekly, monthly, or quarterly) is critical for making data-driven decisions about your ecommerce business.
Identify the ecommerce metrics and KPIs that move the needle for your company, and you’ll be able to spot trends quickly so you can take action and update your strategy, keeping your business on track for growth.