

Whether you’re building a marketing strategy from scratch or you’re updating an existing plan, marketing statistics can help. They highlight channels and formats to experiment with and reveal important trends.
That’s why I rounded up the marketing statistics you need to know as you fine-tune your strategy.
From digital channels like content and social media to traditional channels like direct mail and TV, this list covers 65 helpful marketing stats for B2C and B2B marketers.
Key Takeaways
- Businesses dedicate the largest percentage of their marketing budget to paid channels.
- Email marketing has the highest ROI of all organic marketing channels, but search engine optimization (SEO) and direct mail also have a relatively high ROI.
- Video marketing is a key area of investment for many businesses, but its ROI remains relatively low.
General Marketing Statistics
1. The compound annual growth rate (CAGR) for B2C marketing spending is projected to grow by 6% across channels. CAGR for tech and data spending is forecast to grow the most (by 11%), while the CAGR for traditional paid media spending is forecast to shrink the most (by 1%). (Statista)
2. B2B marketers face declining budgets, which means they increasingly have to do more with less. On average, B2B marketing budgets equal just 7.7% of the company’s total revenue, which is a post-pandemic low point. (Gartner)
3. Despite declining budgets, B2B marketers intend to shift spending and increase investments in several channels and formats. 61% plan to spend more on video, 51% intend to invest in thought leadership content, and 40% aim to increase investments in AI tools. (Content Marketing Institute)
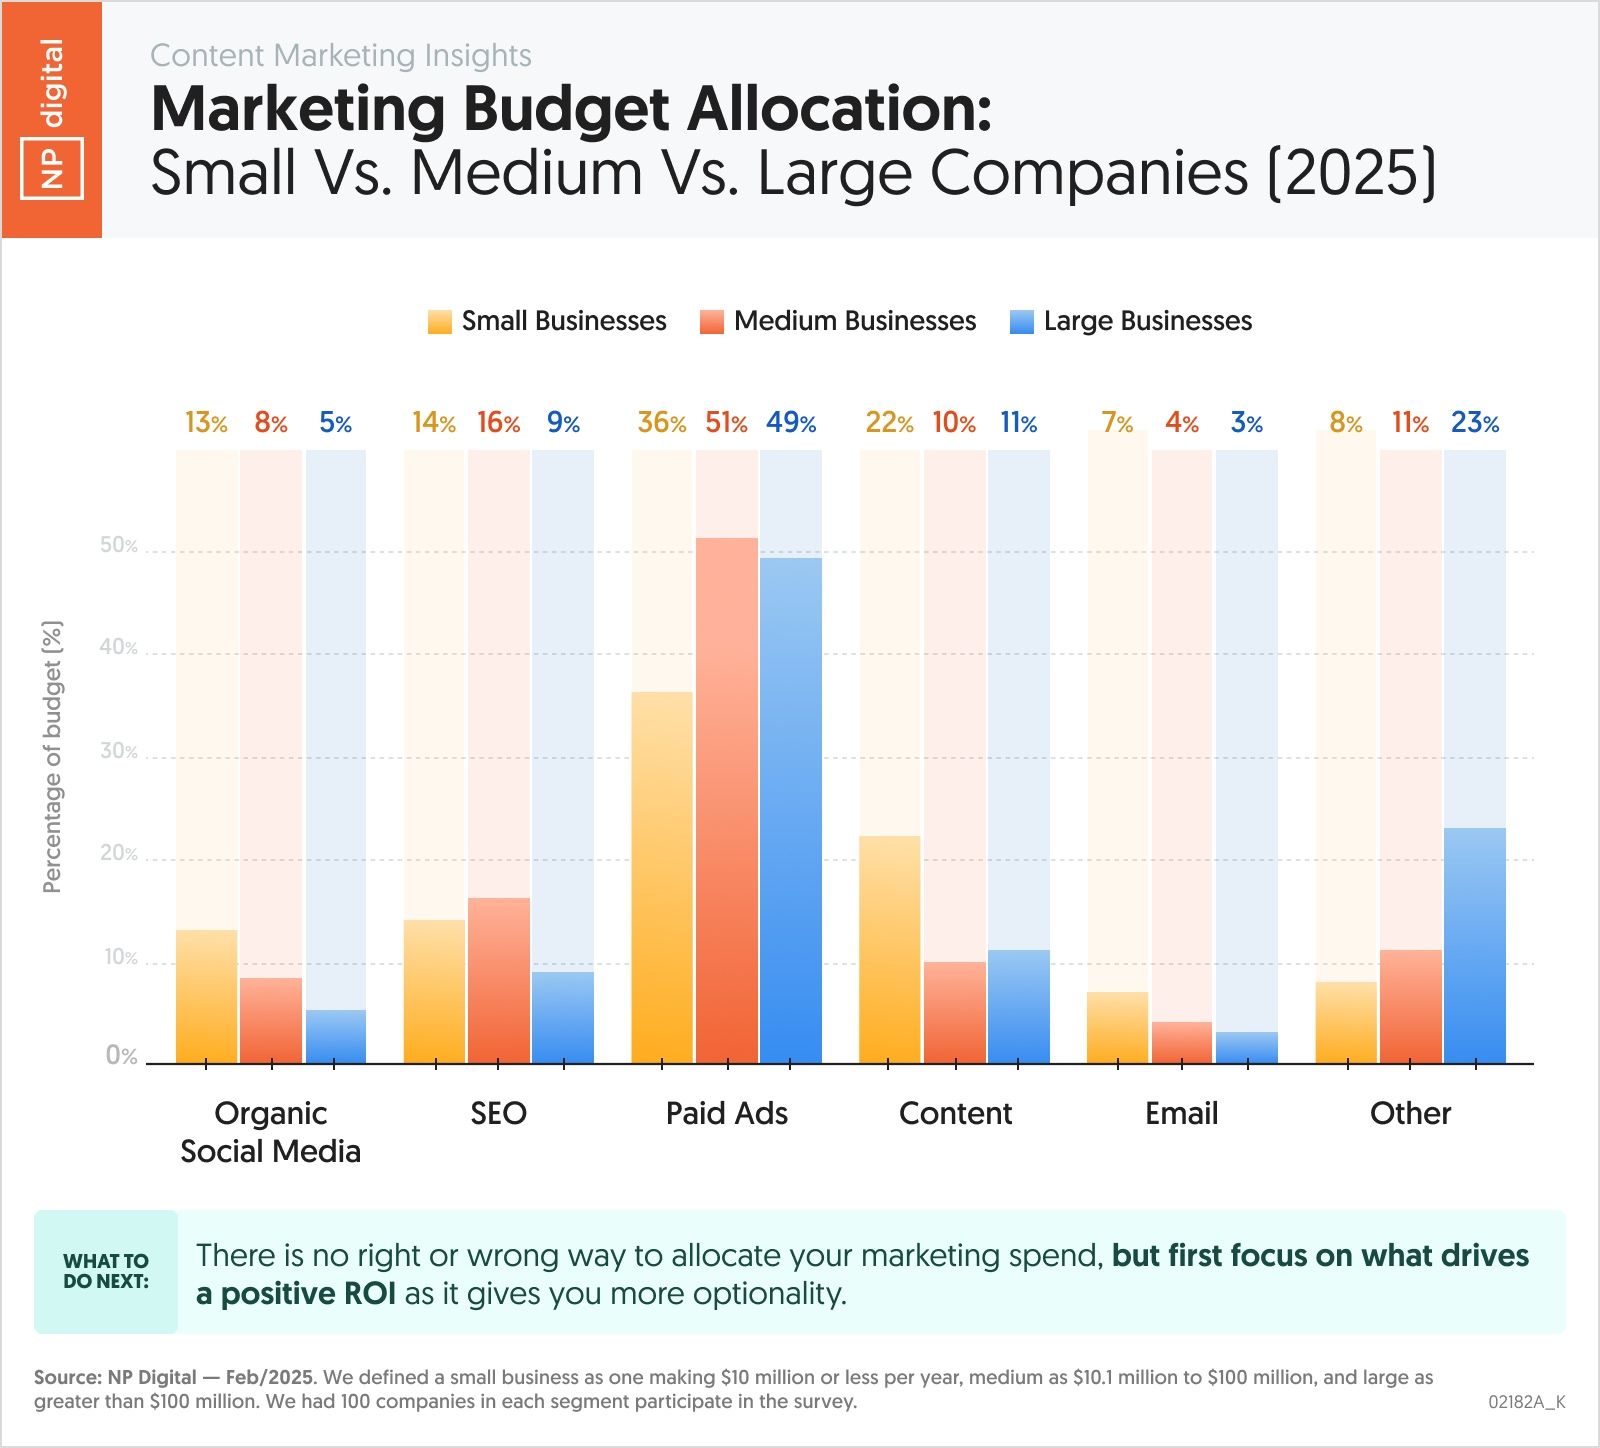
4. Businesses of all size allocate the most budget to paid ads. Small businesses allocate 36% of budget, medium businesses allocate 51%, and large businesses allocate 49%. Content marketing and SEO tie for second. (NP Digital)
5. Top-of-funnel marketing efforts are a key priority for almost all B2B and B2C brands. 92% of marketers intend to maintain their current investments or spend more on brand awareness. (HubSpot)
6. To achieve key performance indicators (KPIs), most marketers prioritize short-term efforts. More than a third (69%) of marketing budgets go to short-term performance, while 31% go to long-term brand building. (Chief Marketing Officer Alliance)
7. Most marketers’ KPIs center on pipeline, revenue, and the sales funnel. Nearly two-thirds of marketers monitor pipeline (64%) and funnel (63%), which reflects how closely aligned they are with sales teams. (Salesforce)
8. Personalization is critical for driving revenue across channels. In fact, 94% of marketers report that personalization increases sales. 77% of marketers rely on generative AI to produce personalized content efficiently. (HubSpot)
9. CMOs are confident in the marketing data they have, but data access often holds them back. More than three-quarters (77%) are confident in their data, but just half (51%) have access to all the data they need. (Chief Marketing Officer Alliance)
10. In the past, marketers have used third-party data to measure and attribute marketing results. However, this practice is declining. Today, more than a third of B2B marketing teams (38%) report not using third-party data in their campaigns. (Salesforce)
Marketing Statistics by Channel
Use these traditional and digital marketing statistics to guide the channels your team prioritizes, the way you build your content strategy, and your marketing campaign benchmarks.
SEO Statistics
11. SEO provides a better return than pay-per-click (PPC) ads. SEO has an average ROI of 8.13x, while PPC has an average ROI of 4.04x. (NP Digital)
12. The ROI of SEO continues to increase as websites age. In year one, established websites generate 22.1% ROI on average. By year five, they generate 198.5% ROI. (NP Digital)
13. Out of all types of web pages, blog posts drive the most SEO traffic (29%). Tools come in second (17%), while homepages come in third (13%). Pricing (3%), support (3%), and press (2%) pages drive the least SEO traffic. (NP Digital)
14. The ideal content length for SEO has decreased over time. Content with at least 1,000 words attracts the most SEO traffic, and content with fewer than 1,000 words drives significantly less. (NP Digital)

15. In the short term (i.e., from months one to 10), it’s faster and easier to rank in YouTube search compared to Google search. But in the long term (i.e., after month 11), Google tends to generate more consistent SEO traffic. (NP Digital)
Content Marketing Statistics
16. The content marketing industry is estimated to reach $107 billion in revenue in 2026. (Statista)
17. Brand awareness is a top priority for B2C content marketers. 81% focus their efforts on creating brand awareness, while 77% aim to build trust and 71% create content to educate audiences. (Content Marketing Institute)
18. Brand awareness is also a key priority for B2B content marketers. 87% focus on creating brand awareness, while 74% prioritize generating demand and leads. 62% focus on lead nurturing. (Content Marketing Institute)
19. B2B marketers produce a mix of text, video, and image content. 92% produce short articles, 76% create videos, and 57% generate data visualizations. (Content Marketing Institute)
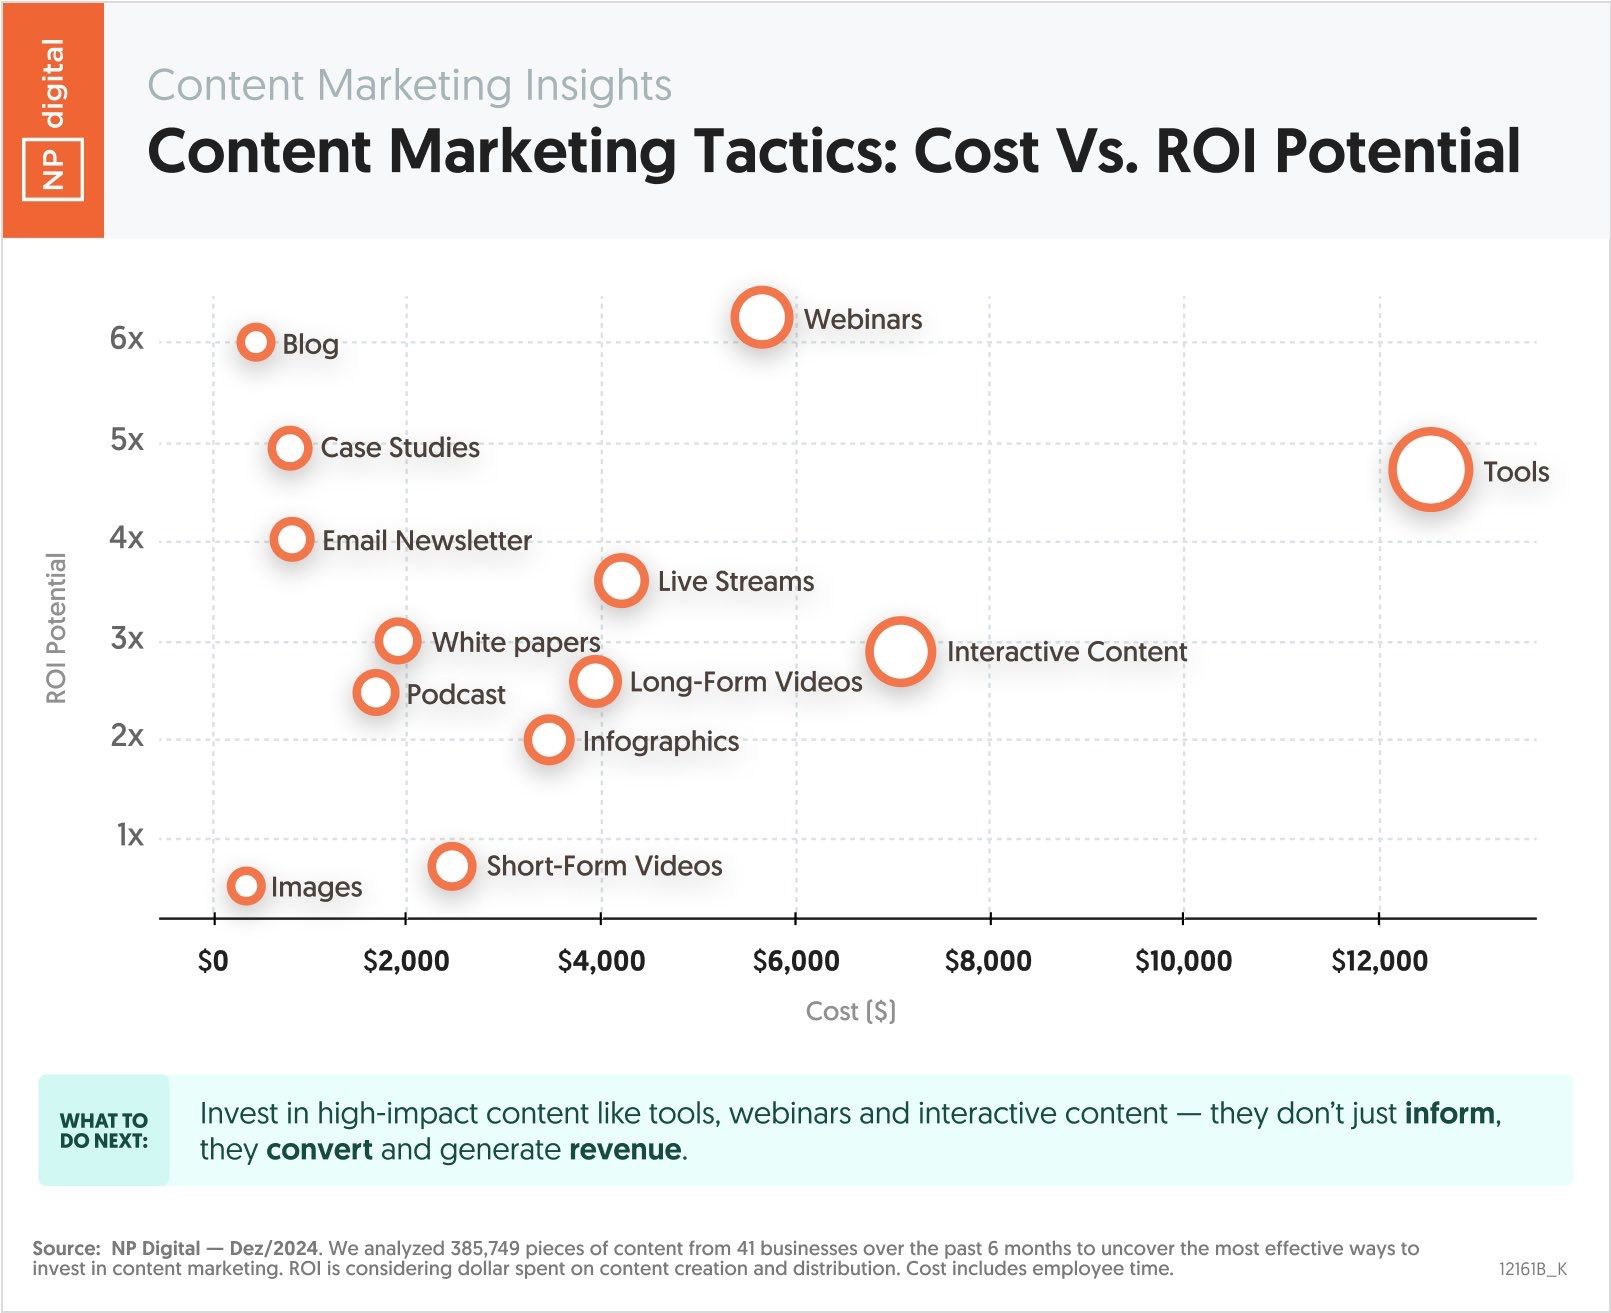
20. Out of all content marketing tactics, blog posts have the highest ratio of ROI potential to cost. In contrast, short-form videos tend to have the lowest ROI-to-cost ratio. (NP Digital)
Email Marketing Statistics
21. Most digital marketers in the U.S. spend between $1,001 and $5,000 per year on email marketing. (NP Digital)
22. On average, email marketing has better ROI than any other marketing channel. Every $1 that marketers spend on email marketing generates $36 in return. Email marketing tends to be most profitable for retail, ecommerce, and consumer goods brands, which have an average ROI of 45:1. (Litmus)
23. Email open and click-through rates (CTRs) have increased across industries and countries in recent years. As of 2024, the average email open rate is 45.3%, and the average CTR is 4.7%. (GetResponse)
24. Among automated email campaigns, welcome emails perform the best. These campaigns have an average open rate of 83.6% and an average CTR of 16.6%. (GetResponse)
Social Media Marketing Statistics
25. Facebook is the most popular social media marketing channel, with about 57% of marketers using it. Instagram is a close second, with about 55% of marketers leveraging it, and YouTube is a close third, with about 52% of marketers using it. (HubSpot)
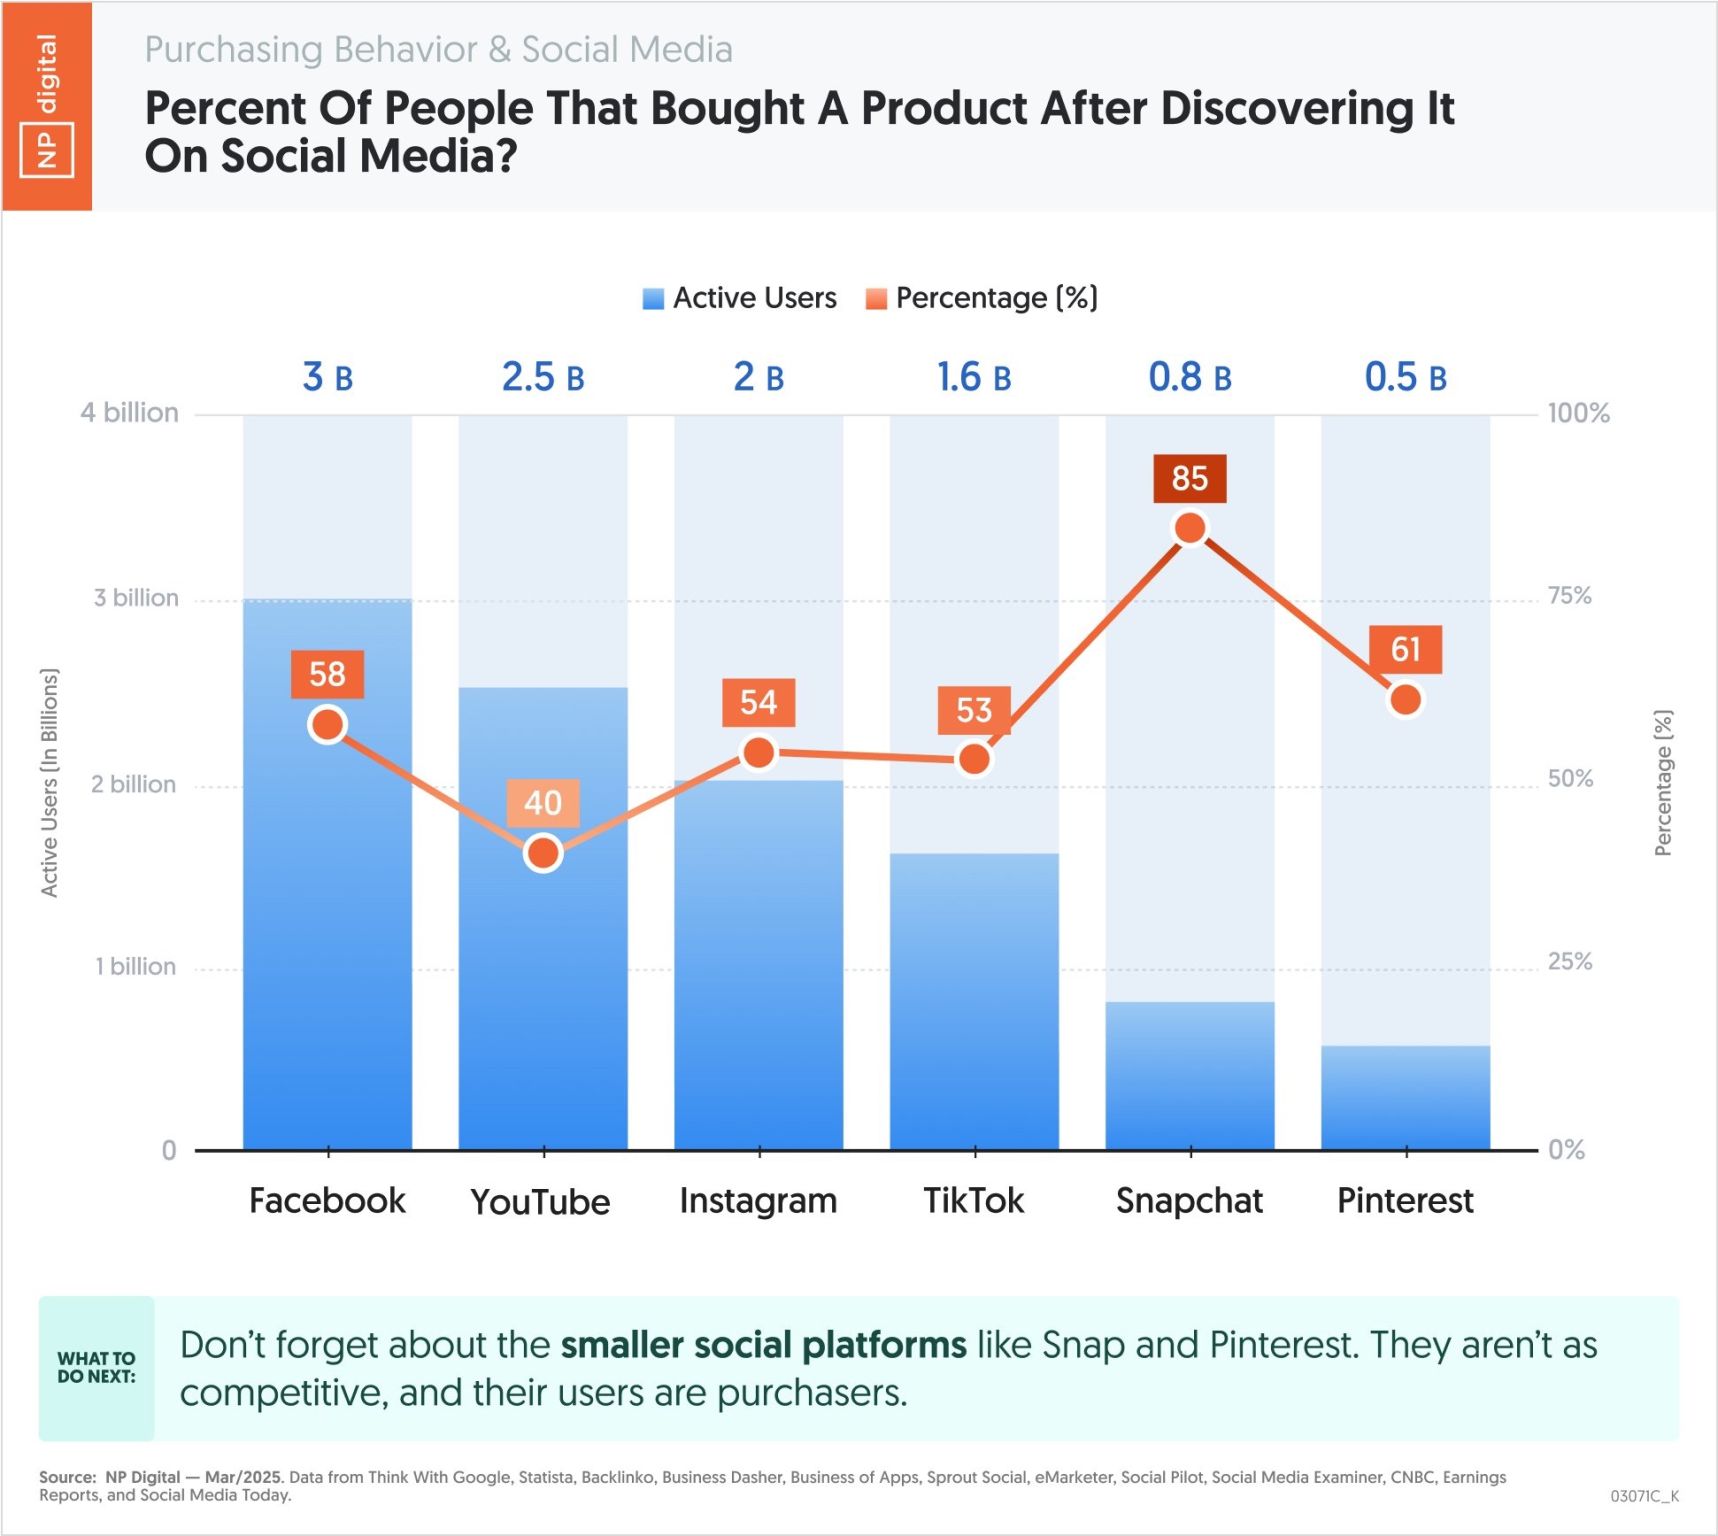
26. Snapchat is one of the smaller social media channels, but it drives the most post-discovery purchases. 85% of people bought a product after discovering it on Snapchat. Pinterest comes in second (61%), and Facebook comes in third (58%). (NP Digital)
27. Social media marketing has become an essential content distribution channel for B2B. 89% of B2B marketers report using organic social media posts to distribute content. (Content Marketing Institute)
28. For B2B companies, LinkedIn is the top-performing channel by far. 85% of B2B marketers report that LinkedIn delivers the best value. (Content Marketing Institute)
29. As important as inbound marketing is, some of the most successful brands also use outbound marketing efforts. 41% of organizations proactively engage with influencers, customers, and other target accounts. (Hootsuite)
Video Marketing Statistics
30. 93% of businesses rate video as an essential part of their marketing strategy. 38% use video to generate leads, while 31% use video for product education and adoption. (Wistia)
31. Video marketing is a top area of investment for B2C. In 2023, 77% of B2C marketers expected to invest in video marketing. (Content Marketing Institute)
32. Video is the top-performing channel for B2B. 58% of B2B marketers report that video content produces the best results for the brand. (Content Marketing Institute)
33. Most businesses tend to create more long-form than short-form videos. 35% report that 5-30 minutes is the most common video length, and 18% report that 1-3 minutes is the most common. (Wistia)
34. Webinars perform particularly well for B2B. 51% of B2B marketers report that webinars are a top marketing tactic. (Content Marketing Institute)
35. Out of all video content formats, marketers report that short-form video (21%) and livestreams (16%) drive the highest ROI. (HubSpot)
TV Marketing Statistics
36. Viewers who subscribe to streaming services often provide a captive audience. Two-thirds (66%) of TV viewers in the U.S. would rather watch ads than pay $4 or $5 for an ad-free viewing experience. (Statista)
37. The average cost per 1,000 impressions (CPM) for Over-the-Top (OTT) advertising is $25 to $75. Popular streaming services (e.g., Hulu) are often at the higher end of that range—$50 to $75. (Clutch)
38. Non-disruptive TV marketing tends to perform particularly well on streaming services. Non-disruptive ads can boost brand awareness by 24% and increase ad recall by 25%. (Clutch)
Radio Marketing Statistics
39. Global spending on radio marketing is expected to reach $28.5 billion in 2025. This amount is forecast to change by a CAGR of -0.5%, declining to $27.8 billion in 2030. (Statista)
40. The U.S. is a top spender on traditional radio advertising. In the U.S., advertisers spend an average of $9.14 per radio listener. (Statista)
41. Traditional radio marketing is on the decline. By 2030, the number of listeners in the traditional radio advertising market is expected to be 0 users. (Statista)
Podcast Marketing Statistics
42. Podcast marketing is a growing channel for both B2C and B2B brands. Altogether, 91% of marketers intend to maintain or increase their podcast and audio content marketing investments in 2025. (HubSpot)
43. Podcast searches overtook blog searches in June 2023. Since podcasts continue to attract more interest and because there are far fewer podcasts than blogs (4.3 billion versus 1 billion) they present a smart investment for many brands. (NP Digital)

44. Podcast marketing successfully drives sales. Almost half (46%) of weekly podcast listeners report having bought a product or service after hearing about it on a podcast. (Edison Research)
45. Compared to TV and online media, podcasts are better at improving brand awareness. Podcast ads are 34% more effective at increasing awareness. (Acast)
46. The ROI from podcast advertising is high, making it one of the best performing channels. Podcast ads deliver an ROI of 4.9x on average. (Acast)
Direct Mail Marketing Statistics
47. Direct mail marketing is on the rise, as marketers intend to double their volume. From 2024 to 2025, average volume is expected to increase from 35 million to 67 million. (Lob)
48. Direct mail drives high ROI across industries. 79% of executives report that direct mail is their best-performing marketing channel. (Lob)
49. While direct mail is an effective marketing channel for many industries, formats vary. 80% of healthcare marketers and 72% of financial services marketers use letters, while 76% of automotive companies and 59% of insurance providers send brochures. (Lob)
Influencer Marketing Statistics
50. Nearly a quarter (24%) of marketers use influencer marketing campaigns in their marketing strategy. (HubSpot)
51. Both B2C and B2B marketers report building the most successful relationships with micro influencers (10,000 to 99,999 followers). 44% of B2B marketers and 43% of B2C marketers have the most success with these influencers (HubSpot)
52. Micro influencers drive the highest ROI (36.71%). Mid-size influencers with 100,000 to 500,000 followers come in second (13.98%). However, both macro influencers (500,000 to 1 million followers) and celebrities (1+ million followers) tend to have a negative ROI. (NP Digital)

53. 28% report that Facebook drives the highest ROI for influencer marketing, while 22% report that Instagram is best for ROI. (HubSpot)
54. Influencer marketing may not be a long-term play. 86% of B2C and B2B marketing leaders think it’s likely that social media avatars or AI influencers will replace human influencers before 2026.
Affiliate Marketing Statistics
55. In the U.S., affiliate marketing spending has grown steadily since 2023, increasing by about $1.25 billion each year. It’s anticipated to reach $13.2 billion in 2026 and $15.8 billion in 2028. (Statista)
56. On average, affiliate marketing delivers a 12:1 return on ad spend (ROAS). (Rakuten)
57. Marketers in the U.S. use affiliate programs throughout the purchase funnel. But the largest groups of marketers report using affiliate tactics at the awareness (56%) and consideration (58%) stages. (Emarketer)
58. Most affiliate marketers use a mix of channels to promote offers. SEO is the top channel, with 78% of marketers using it to drive affiliate traffic. Social media comes in second (36%), and email comes in third (23%). (Authority Hacker)
Digital Advertising Statistics
59. Paid marketing is critical for the vast majority of B2B brands. 84% of B2B marketers use paid channels, with 73% using social media ads, 64% using search engine marketing, and 62% using digital display advertising. (Content Marketing Institute)
60. Amazon ads have the highest average conversion rate (8.57%). LinkedIn comes in second (4.94%), while Bing comes in third (3.05%). (NP Digital)

61. Digital ad spending is projected to increase significantly across channels and formats. In 2028, global digital ad spending is forecast to reach $900.3 billion. Search advertising will account for over $400 billion of the total, and video advertising will account for over $200 billion. Banner ads will account for nearly $200 billion. (Statista)
62. Facebook ads cost an average of $0.26 to $0.50 per click. The average cost per 1,000 impressions (CPM) for Facebook ads is $1.01 to $3. (NP Digital)
63. On average, CPC for Instagram ads ranges from $0.40 to $0.70. CPM for Instagram ads ranges from $2.50 to $3.50. (NP Digital)
64. LinkedIn ads have an average CPC of $2 to $3. The average CPM for LinkedIn ads is $5.01 to $8. (NP Digital)
65. The Out-of-Home (OOH) advertising market is expanding in the U.S., where it’s expected to reach $41.8 billion in 2025. The largest market is traditional OOH advertising, which has a volume of $22.8 billion. (Statista)
Conclusion
While these marketing trends and statistics should inform your strategy, reviewing this data is just the first step in developing and implementing a marketing plan for your business.
Our agency can help. Contact us to learn how we can grow your revenue with SEO, email marketing, paid media, and other channels.
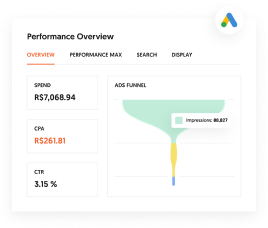
Are You Using Google Ads? Try Our FREE Ads Grader!
Stop wasting money and unlock the hidden potential of your advertising.
- Discover the power of intentional advertising.
- Reach your ideal target audience.
- Maximize ad spend efficiency.