 Sign In












Almost every single marketer uses Google Analytics.
That includes brand new startups and million-dollar companies alike.
One good reason is the price. (It’s free.)
However, the other is that it gives you a treasure trove of data to customize and manipulate. You can also use it to run detailed reports.
Google Analytics excels at providing you with excellent information about who’s coming to your site, what they’re reading, and whether there were any downloads or purchases.
But one of the big problems is that it tells you these facts in total or aggregate.
That creates a ton of gaps in your data.
Staying on top of these problem areas is the only way to get accurate, trustworthy data.
Here are 5 Google Analytics loopholes you probably don’t know about. You can use them to close those gaps ASAP.
1. Beware of falling for vanity metrics
Let’s say your traffic just exploded overnight.
A blog post goes viral when you least expect it. Your Google Analytics shows 100,000+ pageviews.
You feel like an SEO mastermind. The Zuckerberg of keyword research.
But the truth can bring you back down to Earth.
Traffic and pageviews are vanity metrics. Surface-level data like this can’t dictate your marketing decisions.
They’re fun to look at, like window shopping on 5th Avenue in NYC.
But at the end of the day, their beauty is only skin deep.
Why? Those metrics don’t tell you what drives ROI.
Landing 100,000+ hits in a single day can make you feel awesome. Unfortunately, however, the numbers don’t matter if none of those visitors converted.
Any marketer who checks their analytics will head over to “Behavior,” and “All Pages” to sort their traffic by “Source/medium”: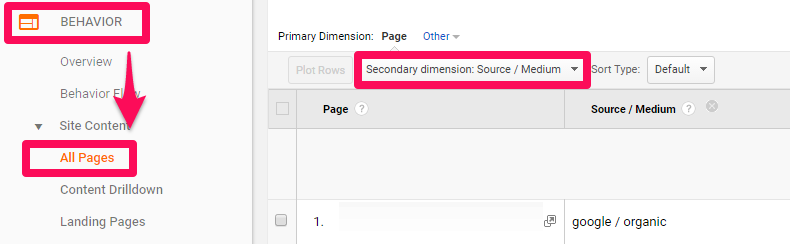
Then they’ll check out which pages are doing well to see what’s working and what’s not.
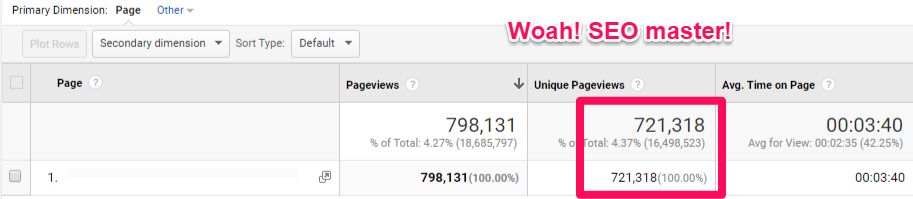
Just when you think you’re the next Zuckerberg, you look a few boxes to the right and notice that something’s wrong.

The bounce and exit rates show the truth on this page.
The harsh reality is that, while pageviews have shot through the roof, nobody’s sticking around.
All that traffic you worked so hard to get was nearly worthless (except for bragging purposes).
You just spent hours, days, or even weeks on developing that piece of content.
The main focus should’ve been on what that traffic was doing once it hit your site.
Here’s one trick to avoid falling prey to vanity metrics.
Instead of treating these vanity metrics like the end-all, be-all finish line, focus on events, goals, and conversion actions.
Start by heading over to “Behavior” and then “Pages.”
Here, you can click on each page and see what conversion events happened on that page.
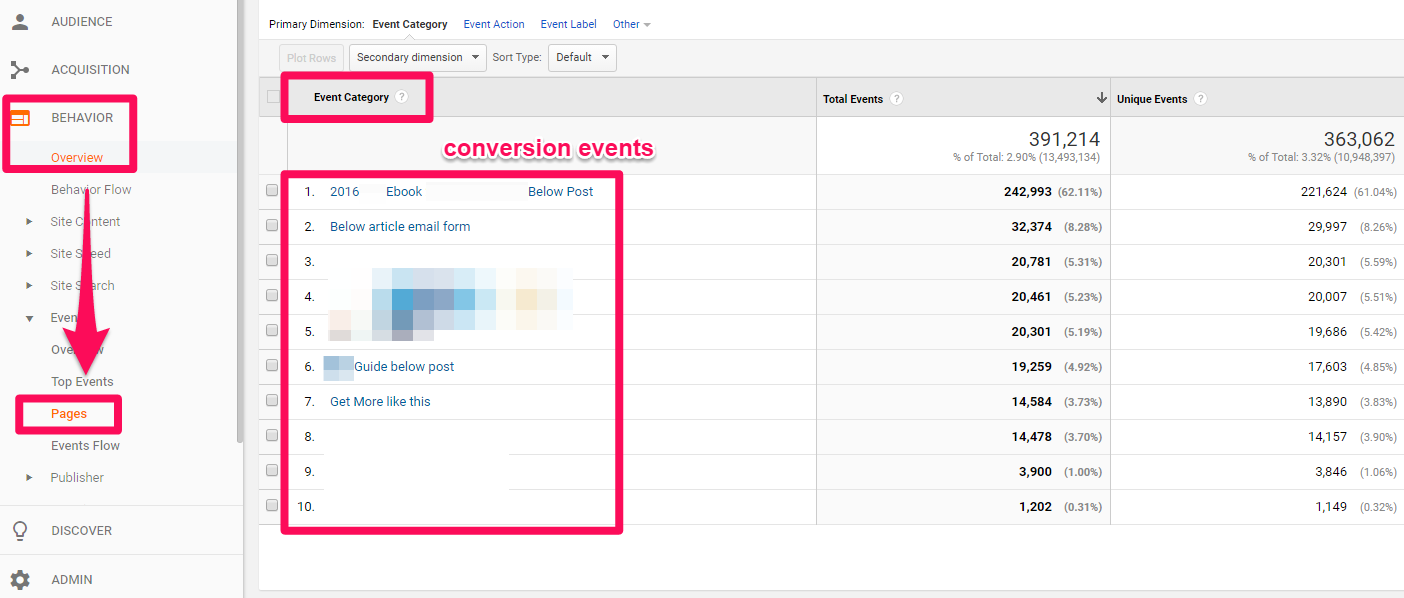
Depending on your own Google Analytics setup, you can also get goal conversions here.
You can even get granular with this information to see which form fields or CTAs on the same page performed best.
Moving past vanity metrics is just the first step in a long journey.
The next step is to figure out why your phone is ringing and where the call is coming from.
2. How to see which pages are driving phone calls
The average landing page conversion rate is 2.95%
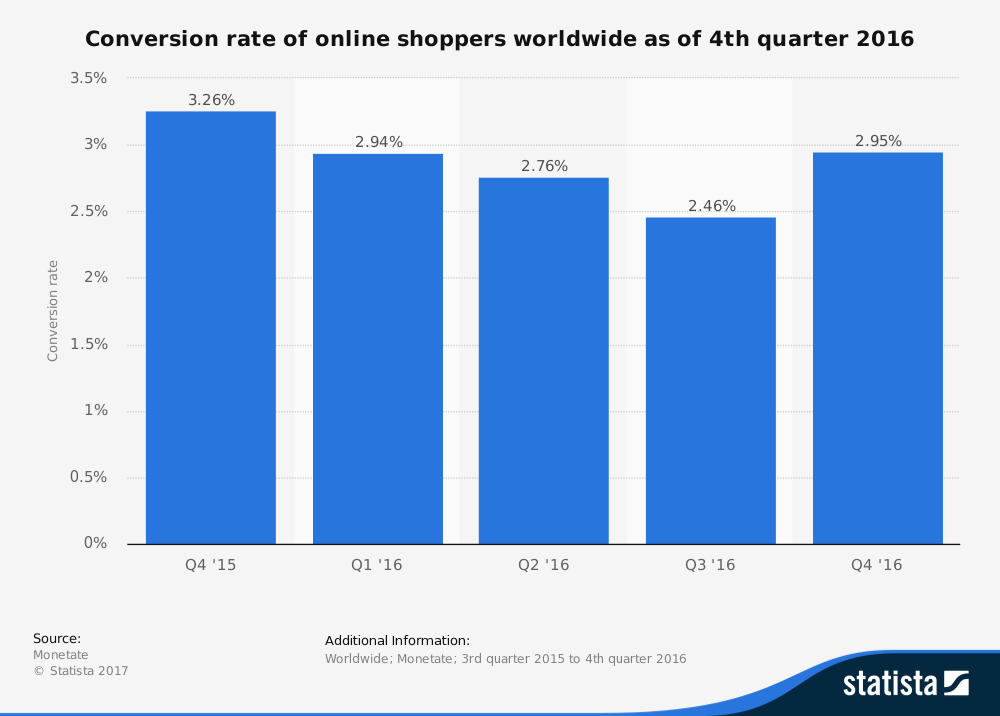
That’s pretty depressing if you ask me.
Think about what it means for your website.
You spend all of this money on AdWords, create a ton of content for SEO, and spend countless hours on social media. You put in all of this work to drive traffic back to your site.
Only now, you see that most of it bounced!
Fortunately, there is one channel that converts much higher than your website.
Phone calls have the power to convert between 30-50% according to a study from Invoca.
Now that’s more like it!
Just adding a simple phone number to your content might give your 2.95% conversion rate a 25x increase.
It’s that simple, right? What could go wrong?
The problem is that, according to that same Invoca report, digital action drives around 70% of your phone calls.
Those “actions” include searches, ads, and referrals.
And you typically won’t see any of that information inside Google Analytics.
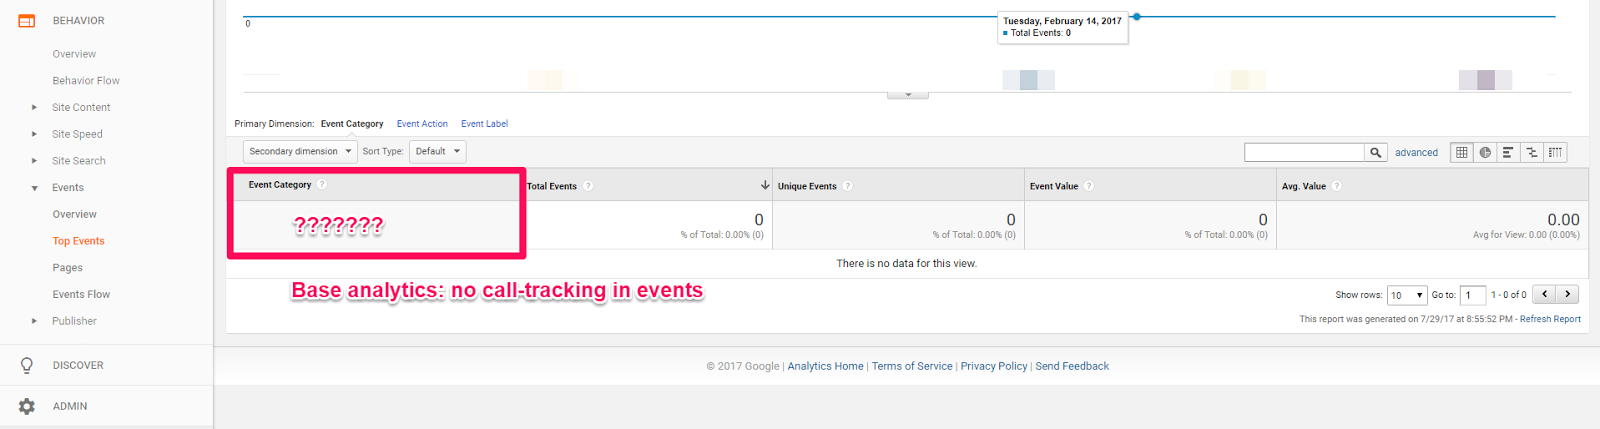
So unless you’ve set it up, your calls might as well be coming out of thin air.
The phone will ring, which is great. But you won’t know why or what’s driving those phone calls, which is bad.
For example, let’s say the caller just became a customer to the tune of $500.
Awesome! However, what did you spend to get that person to the conversion stage in the first place?
Right now, you have no idea.
You’re not even sure if the customer found you via PPC ads, organic search, or direct traffic.
While a new $500 customer sounds great at first, it might not be if you spent $750 to get them in the door.
Thankfully, you can use event tracking again to start getting actionable insights from phone-call data.
It’s not perfect, but it’s a good start.
Essentially, you’re tracking every ‘event’ that causes someone to click and call your number.
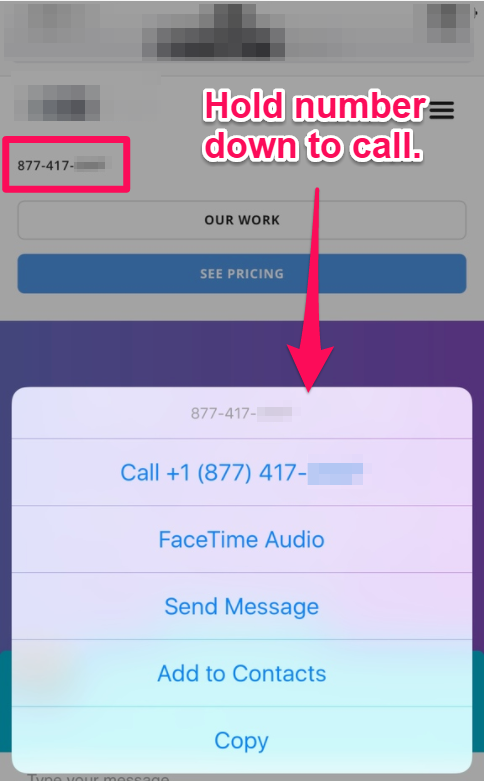
First off, you can setup a click-to-call number by including a tiny line of code before the phone number on your site.
<a href=”tel:+18001112222″>800-111-2222</a>
Now, when someone’s browsing your site on their mobile device, they simply click to call.
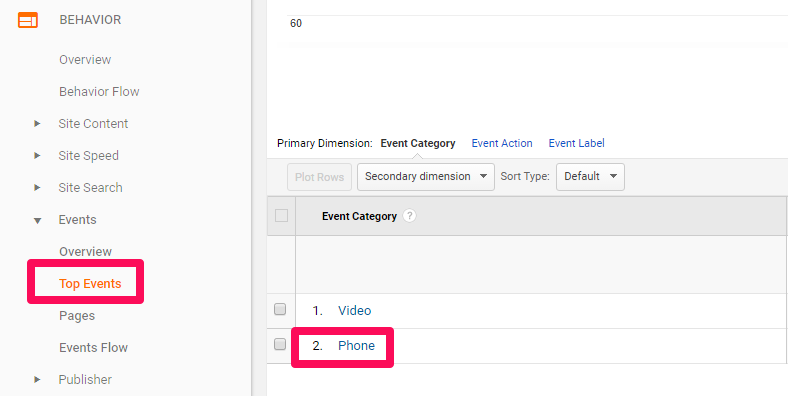
Then your data gets wired straight into Google Analytics. Head over to “Behavior,” and then look for “Top Events” under the “Events” drop down.
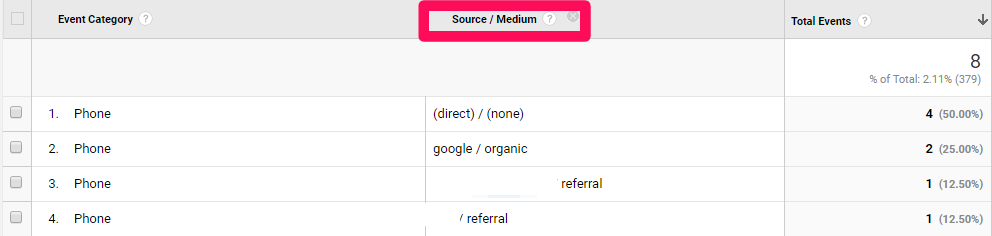
Next, you can sort those calls by “Source/Medium” to finally see what “digital actions” are driving those calls.
I can hear the question that you’re forming next: “But Neil, where did these calls come from originally?”
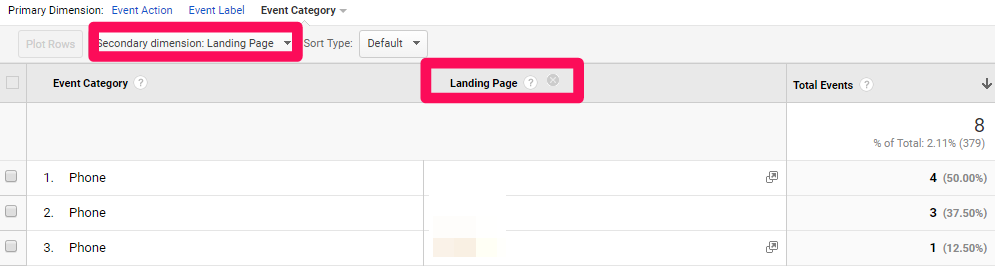
To get the answer, add a secondary dimension for “Landing Page.”
That’s not bad for a free tool!
You can now see which landing pages drive the most phone calls and what sources are driving phone calls to your business.
Just remember that these new phone calls might not always result in a closed customer. Here’s what I mean.
3. Conversions are leads, not customers
It’s the end of the month.
Your marketing reports and KPI’s are due are the end of the day.
You’re rounding up campaigns, double-checking your numbers, and getting ready to deliver the goods.
But then, all of a sudden, you see that organic search only drove two new leads this month.
Yikes, that’s no good! It’s only natural that you start to sweat a little here.
Wait, though, because social drove 11 leads! Bingo, you’re in the clear.
You deliver those KPIs, and your boss immediately says, “Drop the organic campaign and push social.”
It makes sense, right? You drove a measly two leads with organic and 11 with social.
Except that’s not exactly true, and you could be making a huge mistake. Here’s why.
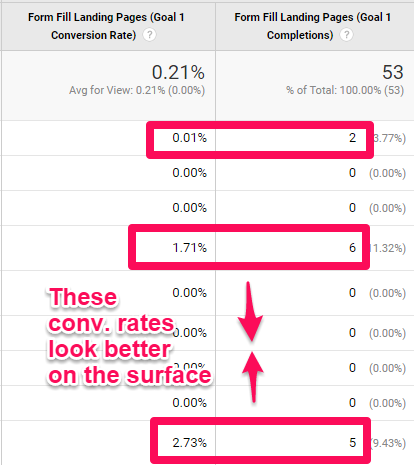
Those “conversions” might technically be “conversions,” but they’re not necessarily “customers.”
That sounds like semantics, right?
But this is incredibly important.
These “conversions” might just be leads. From there, you’ll still have to work to convert them into paying customers or clients.
Just because social had 11 conversions (leads) and organic had two doesn’t mean the organic campaign failed.
Here’s what your conversion goal looks like in Google Analytics.
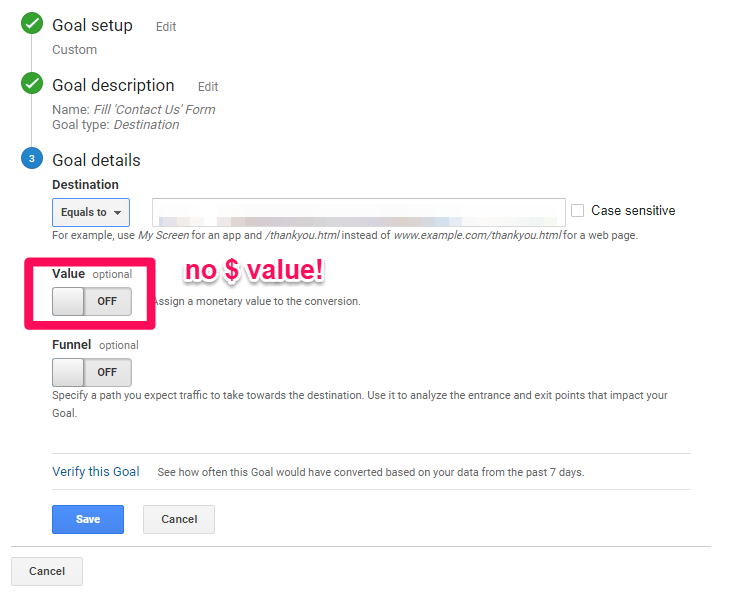
You’re not tracking a conversion value.
Instead of making campaign decisions based on sales, you’re making them based on micro-conversions.
For example, that means you’re changing personnel or budget based on lead counts.
Let me explain the gravity of this situation.
Two SEO leads versus 11 social media leads doesn’t sound great at first.
But when you peel back the layers of analytics, you find that SEO leads converted at half the cost of social.
Next, you find that the lifetime value of those organic leads was 5x higher than social.
In the end, 11 leads from social converted at a higher cost and provided a lower LTV.
So maybe those two leads from organic search end up outperforming the 11 from social.
And now it’s too late. You’ve already “switched gears” and sunk your budget into social.
Surface-level metrics are analytics’ bread-and-butter. But they don’t always show the whole truth.
You can start to address this problem by adding a value to each conversion.
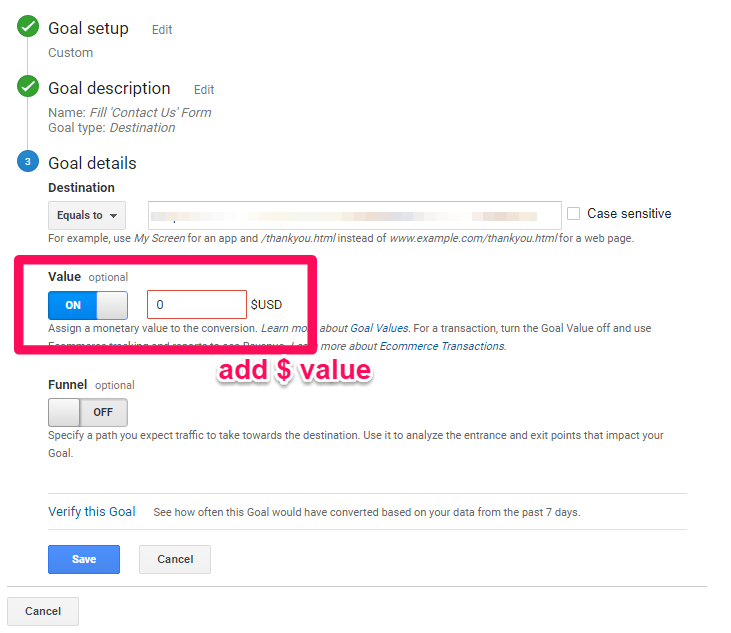
Here’s an example:
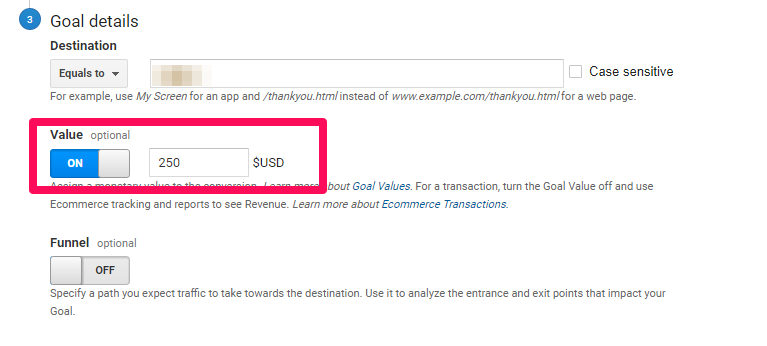
Your average client’s lifetime value is $1,000.
Your sales staff reports an average close rate of 25%.
Do the math, and your average lead value is $250.
Take that number and add it to your Google Analytics goals.
Is this the end-all, be-all of tracking? Obviously not.
But even this overly simplistic example can help a lot.
You can use historical lead values to add a little more context to each goal conversion.
What if you don’t have one yet? No problem.
Launch a quick PPC campaign and cap it at 100 conversions.
Next, compare the money you spend on your PPC campaign to the conversions. With these two numbers, you can calculate a quick-and-dirty cost per lead.
4. Don’t fall for the last-touch attribution bias
People always say that PPC is king when it comes to conversions, while social media is terrible.
Is that true?
You log into your Google Analytics account, and it might seem that way at first glance.
However, you’re likely only looking at the “last touch.”
I see this problem all the time.
Here’s what your Goal Completion numbers might look like in Google Analytics:

It shows that organic search, PPC, and direct traffic are responsible for most of your conversions.
However, let’s take a quick look at Google’s Customer Journey to Online Purchase to see how and why this might be happening.
Google’s free tool gives you a visualization of each channel’s role in assisting conversions. Here’s what it looks like for a big e-commerce site:
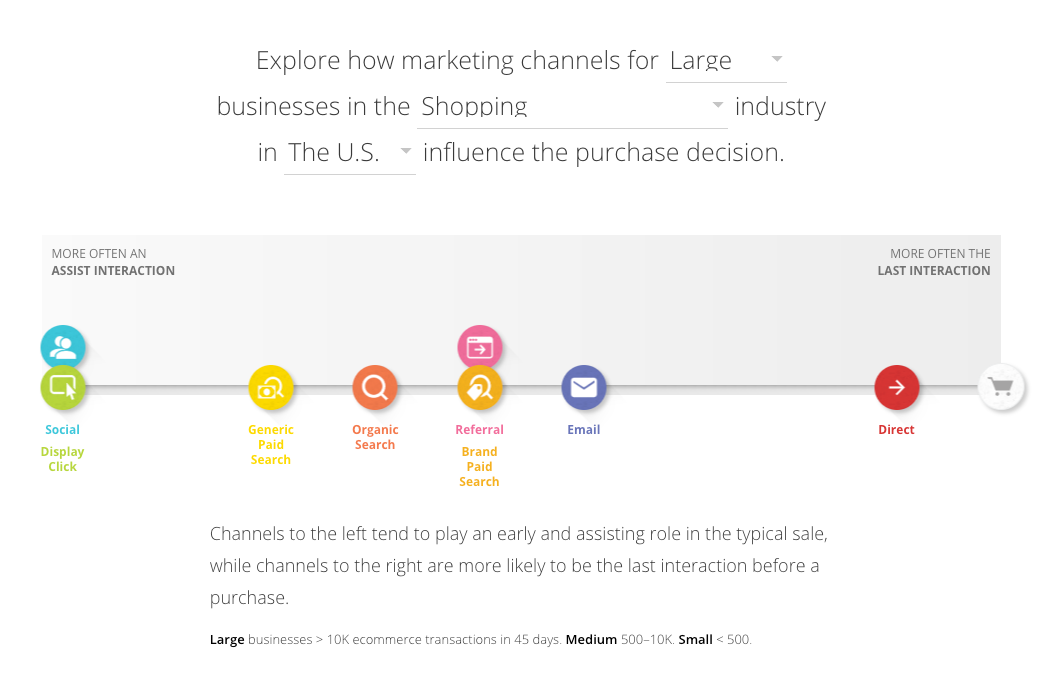
You can see Social and Display at the far left-hand side.
That makes sense when you think about it. These are often the two best places to introduce new people to your brand.
Slide over a little toward the middle and you’ll see both organic search and PPC.
At this stage, people are evaluating their options. They’re starting to shop around and look at your products.
Then, on the far right-hand side, you’ll notice that they’re going to your website directly to purchase.
So what’s happening here?
All of these channels are important at different stages. Yes, people tend to close the deal after clicking on PPC ads or going to your site directly.
But that doesn’t mean your social media efforts are useless. Nobody would have even heard of you without them!
It looks like only those three sources are working properly. In reality, however, each channel played an important role in the entire purchase process.
Your customers might have been introduced to your product through social and display ads.
They searched for products like it and evaluated their options via PPC ads or organic search.
Maybe you even used retargeting ads and emails to bring them back to your site a few times.
Then they headed directly to your site to eventually purchase.
The ‘last-touch bias’ might tell you that direct referrals drive your sales. But clearly, that’s not the whole story.
Instead, you need to switch your attribution model to a multi-step process.
In the conversion reports section, you can analyze conversion paths and assisted conversions. Here are a few of your options.
Your first choice is “Last Non-Direct Click.”
The name pretty much says it all. It gives the conversion credit to the Source/Medium used just before someone visited your site directly.
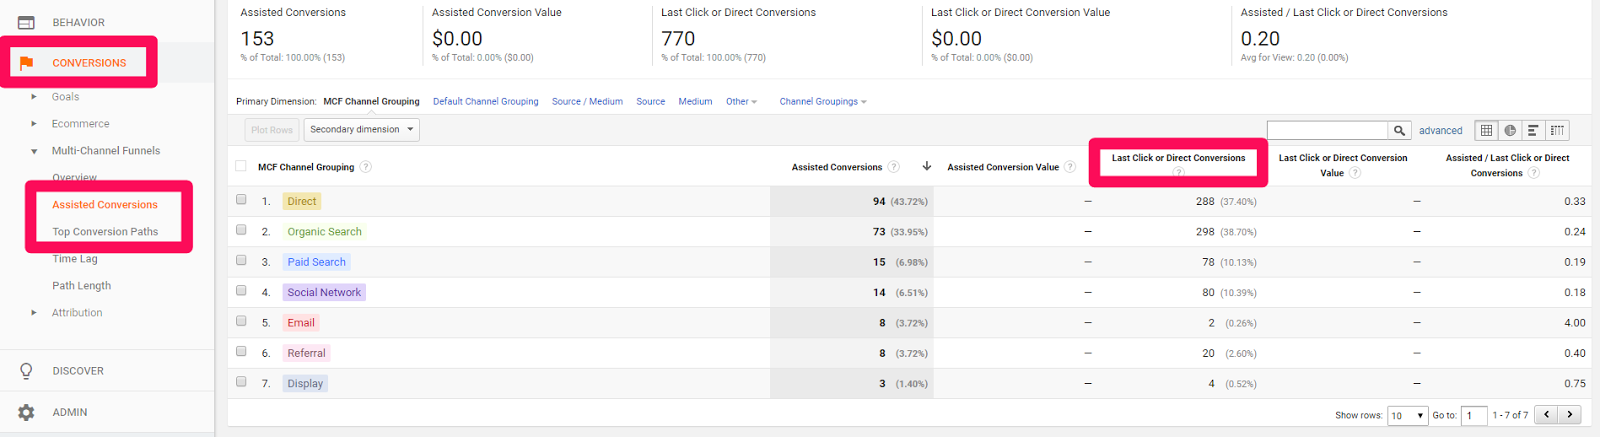
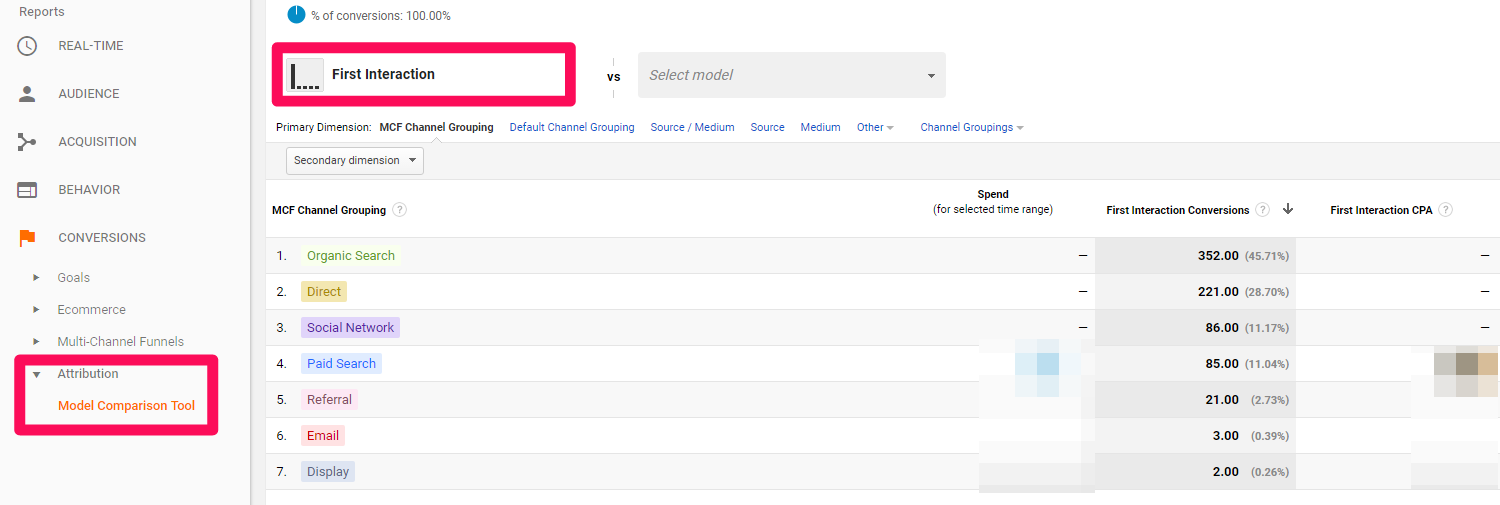
Next, you can use “First Interaction.”
Again, the name pretty much explains it.
This time, your first touch point or channel gets the credit for the sale.
With the “Linear Model,” attribution is divided equally among all channels in the conversion process.
For example, let’s say someone converts after using direct, social, PPC, and organic Search.
In that case, each would share 25% of the credit.
You can see more of this overlap under the “Multi-Channel Funnels” conversion report.
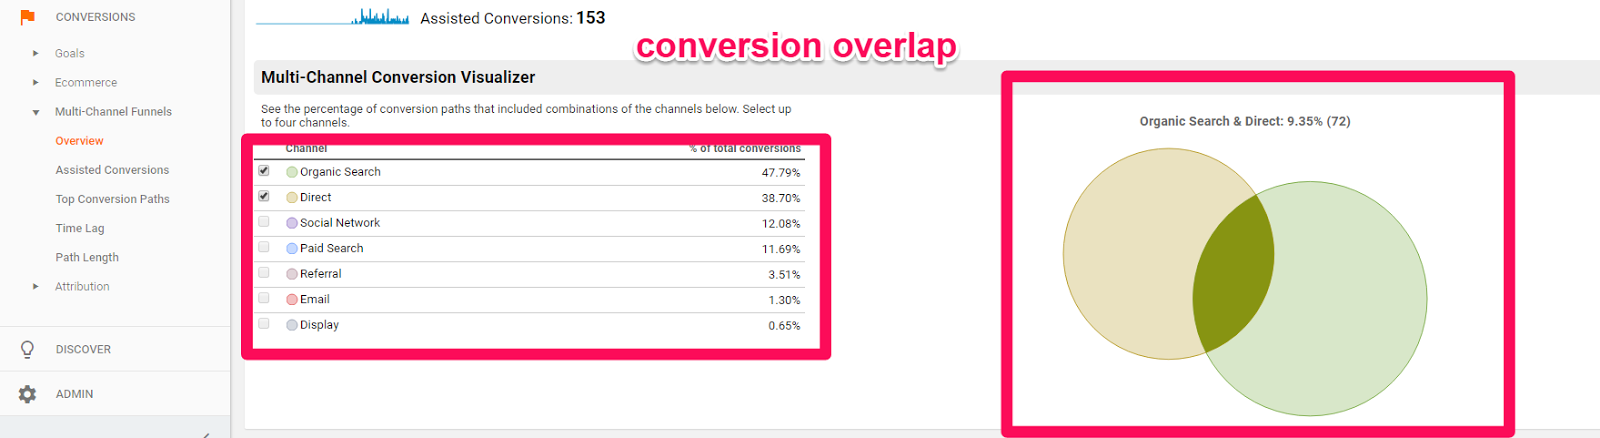
Still not satisfied? Use the “Position-Based Attribution” model.
The “Position” model will assign 40% of the ‘credit’ to the first interaction and the last.
The remaining 20% gets distributed evenly to all the channels used in the middle of the conversion process.
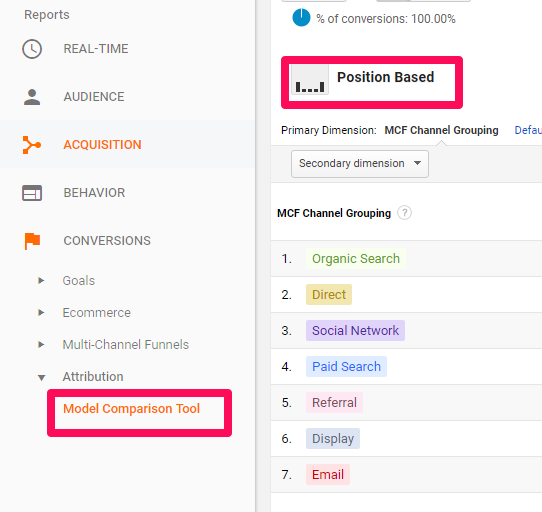
In this case, as you can see above, the bulk of the conversion credit goes to organic and direct.
The last 20% splits between social, PPC, display, and email.
Congrats! You’ve eliminated one of Google Analytics biggest problem areas.
5. Be careful of misleading metrics that lack context
It’s scary to log into Google Analytics and see something that looks like this:
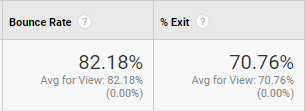
You don’t want to see abnormally high bounce rates on your website!
That’s generally not a good sign.
However, there are always a few exceptions to the rule.
For example, an ‘acceptable’ bounce rate might depend on your website.
E-commerce sites will likely have much lower bounce rates than blogs, for instance.
Average bounce rates might range from 26% to 70%, according to this RocketFuel data.
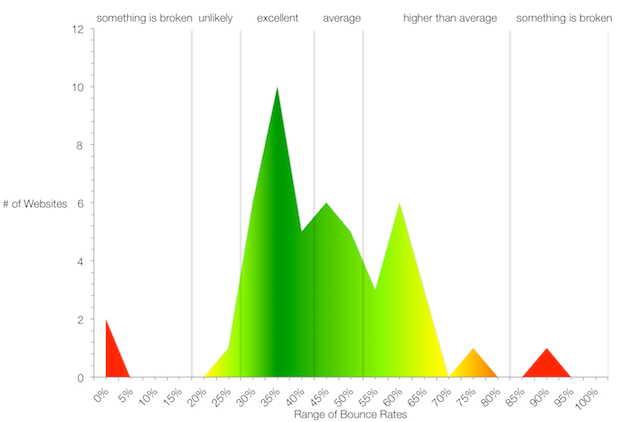
That’s a huge margin.
Here’s where things get tricky.
Let’s say you run a site, and you notice that your bounce rates are higher than the industry average.
However, when you peel back the layers, you see that two new landing pages for PPC campaigns are driving those rates through the roof.
You might think that’s terrifying.
However, in reality, it could be a good sign!
The whole idea of a landing page is to get people to convert.
The last thing you want is for them to go back to the homepage or get distracted by blog content.
A high bounce rate, in this case, might not signify disaster. It could tell you that the landing page is doing its job.
Consider the flip side of this problem now.
You have a high bounce rate, so you immediately start tweaking the page design and layout.
But what if neither of those is the problem?
What if it’s something you didn’t even consider?
Slow page speeds are one of the biggest reasons your traffic bounces.
For example, Kinsta’s page-speed guide found that 75% of your traffic will bounce if a site doesn’t load in five seconds or fewer.
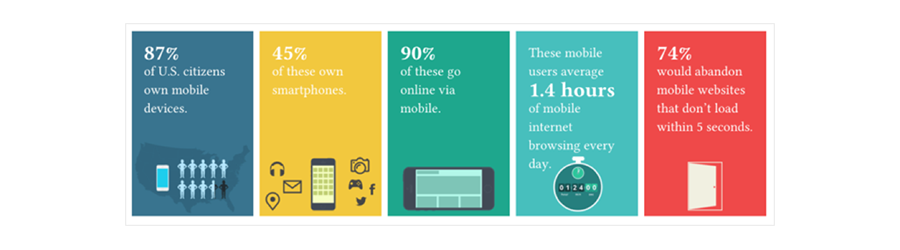
Do you see how confusing this single metric can be now?
Just saying that you have a “high bounce rate” opens up an entire can of worms.
In some cases, it might not be as bad as you think. High bounce rates don’t always come from poor web design, ineffective CTAs, or poorly written content.
However, in other cases, the main culprit might not be on your radar yet.
Google Analytics is awesome, and you should definitely keep using it.
But keep these common issues in mind. And be careful not to make split-second decisions based on some nuanced information. Sometimes you need to put that information in context.
Conclusion
Analytics has become the gold standard for marketing KPIs and monthly reports.
Almost all businesses use Google Analytics to make marketing decisions.
It’s free and easy to set up. Plus, it instantly provides you with actionable data.
But that data isn’t always as cut-and-dried as it appears.
The pageviews and unique visitor data make you feel smart. In reality, though, they are just vanity metrics that suck you in.
Pageviews don’t matter if the visitors didn’t convert, after all. Bounce rates also don’t matter if visitors did convert.
You don’t have to ask every person who calls your business, “How’d you hear about us?” Instead, you can set up call tracking and get the data directly from Google Analytics.
And using the assisted conversions report allows you to eliminate the last-touch bias.
Most people think that there’s no need to customize Google Analytics any further.
You now know better.
What Google Analytics data do you frequently use to make better marketing decisions?