 Sign In







Most Used Visual Content Formats
Info
-
Source: NP Digital
-
Date: November 2025
-
Category: Content Strategy
-
Study Methodology: Sample size: 300 companies; Method: Surveyed companies on visual content formats used most frequently; Numbers rounded to the nearest whole percent.
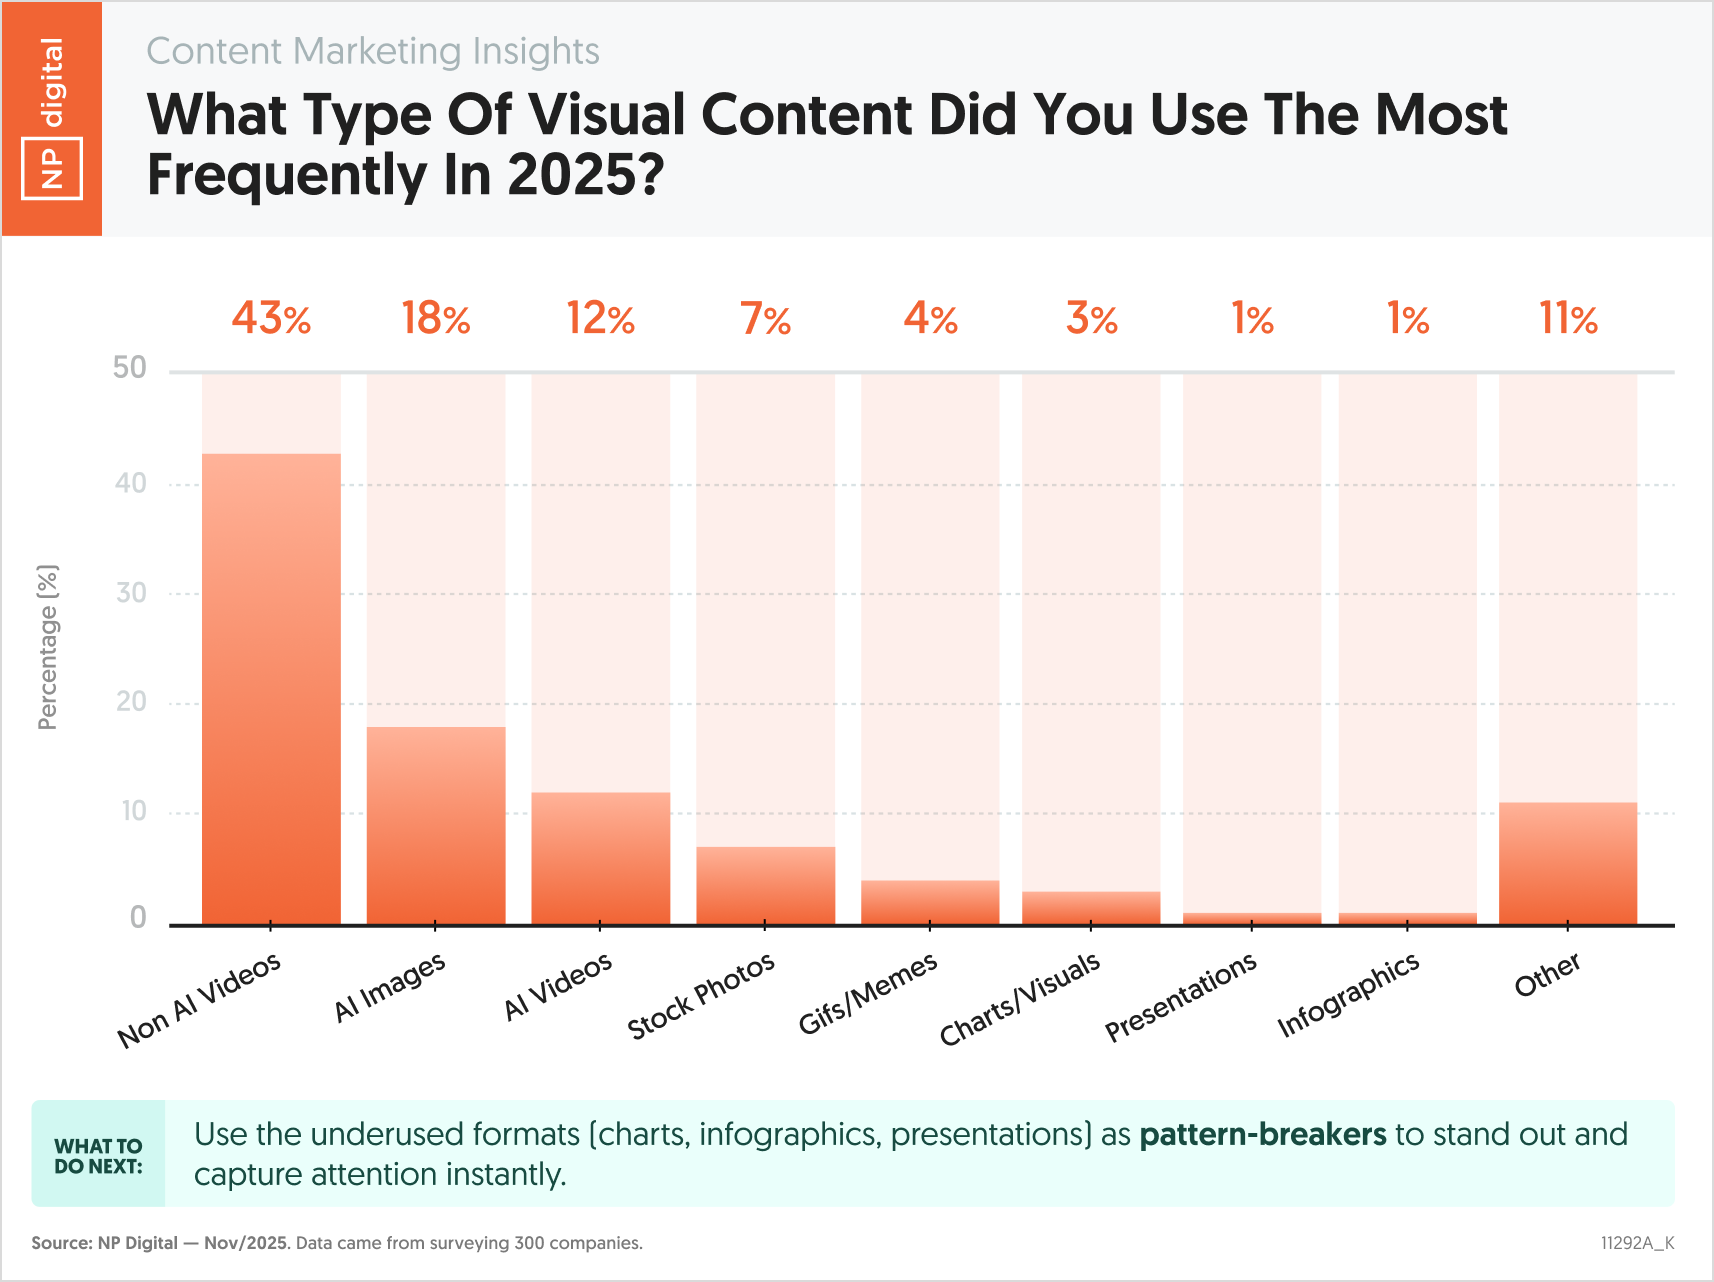
Most teams default to the same visual formats year after year. This chart shows what marketers actually used most frequently. It also highlights where overuse may be creating diminishing returns. The real opportunity lies in the formats few teams invest in but audiences still notice.
Essential Statistics
- Non-AI videos are the most used visual format at 43%.
- AI images rank second at 18%, reflecting rapid adoption for speed and scale.
- AI videos account for 12% of usage, trailing both non-AI video and AI images.
- Stock photos are used by 7% of marketers, showing continued decline in reliance.
- GIFs and memes represent 4% of usage, remaining niche formats.
- Charts and data visuals are used by only 3% of marketers.
- Presentations and infographics are the least used at 1% each.
- Other formats account for 11% of usage.
Key Takeaways
- Video dominates visual content usage, with non AI formats still leading in frequency.
- AI has accelerated production but has not fully replaced traditional video formats.
- Overused formats face increasing competition for attention in crowded feeds.
- Data-driven visuals remain significantly underutilized despite high information density.
- Low usage does not equal low effectiveness, especially for charts and infographics.
- Differentiation increasingly comes from format choice, not just creative quality.
Actionable Insights
- Continue investing in non-AI video, because it remains the most frequently used format at 43% and supports depth and trust. Focus on educational and explanatory videos that retain value beyond short-term trends.
- Use AI images strategically for speed, because their 18% usage shows efficiency gains but rising saturation. Apply them to rapid iteration and testing, not to core brand-defining assets.
- Differentiate with charts and data visuals, because only 3% of marketers use them despite their ability to convey authority fast. Turn proprietary data and insights into simple visuals that break scrolling patterns.
- Reintroduce infographics and presentations for key campaigns, because their 1% usage makes them natural pattern breakers. Use them for launches, reports, and gated assets where clarity and structure matter.
- Limit reliance on stock photos, because their 7% usage reflects declining effectiveness. Replace them with custom visuals or annotated screenshots that feel more authentic and specific.
- Audit visual mix quarterly, because format fatigue reduces performance over time. Shift effort toward underused formats when engagement plateaus instead of producing more of the same.
Everyone is making videos and AI images now. The brands that stand out will be the ones willing to visualize their thinking with charts and original data, not just more motion. – Neil Patel