

Why Scenario Planning Beats a Single Marketing Forecast
Info
-
Source: NP Digital
-
Date: June 2026
-
Category: Measurement & Strategy
-
Study Methodology: Data from IAB and NP Digital. Indexed to 100 at Day 0. Methodology reflects modeled scenario comparison across base, upside, and downside forecast trajectories over a 180-day period.
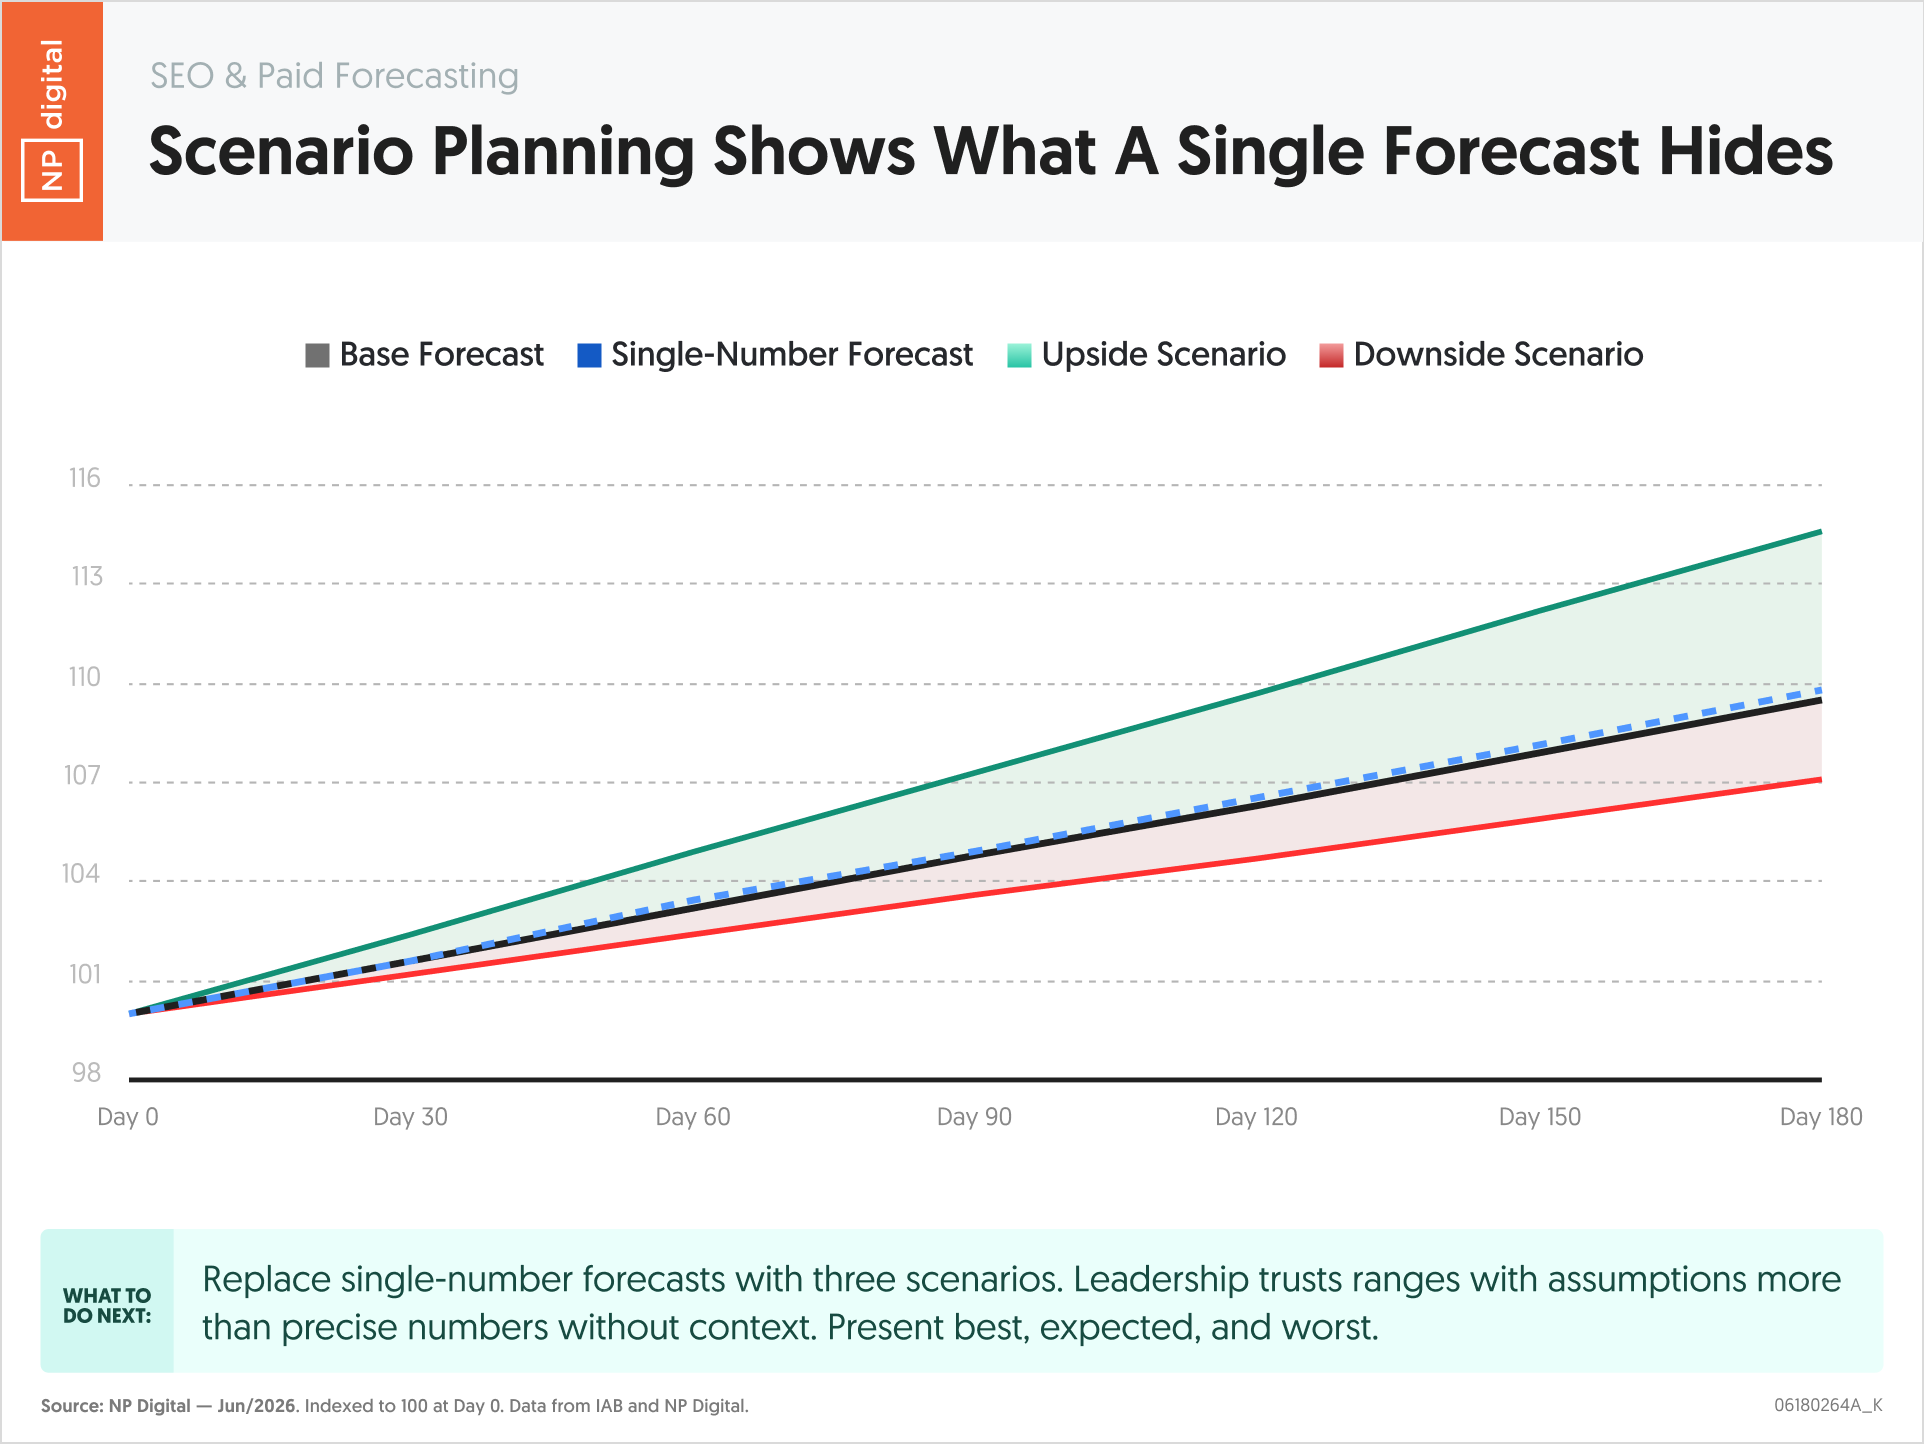
A single forecast number looks precise. It is not. This chart tracks what happens when a base forecast, an upside scenario, and a downside scenario are plotted against a single-number forecast over 180 days. The gap between the upside and downside curves widens steadily over time, and the single-number forecast sits inside that range without communicating any of the uncertainty it contains. Marketing teams that present one number to leadership are hiding the actual range of outcomes inside a false confidence.
Essential Statistics
- The upside scenario reaches approximately 114 by Day 180, while the downside scenario reaches approximately 107, a spread of roughly 7 index points at the end of the period.
- The single-number forecast tracks close to the base forecast, reaching approximately 109 by Day 180, appearing more precise than the scenario range justifies.
- By Day 60, the gap between the upside and downside scenarios has already widened to approximately 5 index points, establishing early divergence that compounds through the rest of the period.
- All four trajectories begin within 1 to 2 index points of each other at Day 0, confirming that uncertainty compounds over time rather than being evenly distributed across the forecast horizon.
- The base forecast and single-number forecast track closely throughout, which illustrates that a single number typically represents the expected case without surfacing the full distribution of possible outcomes.
Key Takeaways
- Single-number forecasts do not eliminate uncertainty but they do obscure it. The upside and downside scenarios in this chart represent the actual range of plausible outcomes, and none of that information reaches leadership when only one number is presented.
- The widening gap between scenarios over time confirms that forecast risk compounds. A 180-day forecast carries substantially more scenario spread than a 30-day forecast, which means long-horizon planning is where scenario framing provides the most value.
- Leadership does not need a precise number. They need a decision framework. A range with named assumptions, best case, expected case, worst case, gives them what they actually need to allocate resources and set contingency plans.
- The proximity of the single-number forecast to the base case throughout the period reveals a common bias: most single-number forecasts implicitly assume the expected case rather than reflecting genuine probability-weighted outcomes.
- Teams that transition from single-number to scenario-based forecasting consistently report higher stakeholder trust because leadership can see the assumptions rather than just the output.
Actionable Insights
- Replace your next forecast presentation with three scenarios labeled best case, expected case, and worst case. Each scenario should have named assumptions driving the variance, not just different percentage growth rates. Leadership understands ranges better than point estimates when the assumptions are explicit, and the conversation shifts from defending a number to aligning on which scenario the business is planning for.
- Build your scenario spread around the variables with the most forecast uncertainty in your category. For SEO-heavy forecasts, AI Overview expansion rate and CTR decay are the highest-variance inputs. For paid media forecasts, CPC inflation and conversion rate volatility drive most of the spread. Name those variables in your scenario documentation so stakeholders know what to watch as leading indicators.
- Update your scenario boundaries quarterly rather than treating them as static. The upside and downside curves in this chart widen over time because uncertainty accumulates. A scenario range built in January will be outdated by June. Set a calendar reminder to revisit scenario assumptions at the start of each quarter and adjust the boundaries based on what has actually occurred versus the expected case.
- Use the Day 60 scenario gap as your early warning threshold. The chart shows meaningful divergence appearing around Day 60. Build a review checkpoint into every 180-day forecast at the 60-day mark to assess which scenario the actual data is tracking toward. Catching a downside trajectory at Day 60 allows budget reallocation before the gap becomes material.
- Present scenario ranges as a credibility signal rather than an admission of uncertainty. Teams that show scenario spreads with explicit assumptions are demonstrating analytical rigor, not weakness. Frame the three-scenario approach to leadership as the methodology used by high-performing forecasting organizations, which the companion data in this batch confirms.
“A single forecast number gives leadership the illusion of certainty. Scenario planning gives them the truth: here is the best case, here is the expected case, here is the worst case, and here are the assumptions that separate them. That is a better conversation and a better planning tool than one number that hides everything it does not know.” – Neil Patel