 Sign In








Retail App Conversion Funnel Benchmarks
Info
-
Source: NP Digital
-
Date: May 2025
-
Category: App Marketing & ASO
-
Study Methodology: Aggregated funnel data from 50 top retail mobile apps. Benchmarks based on session tracking and app analytics.
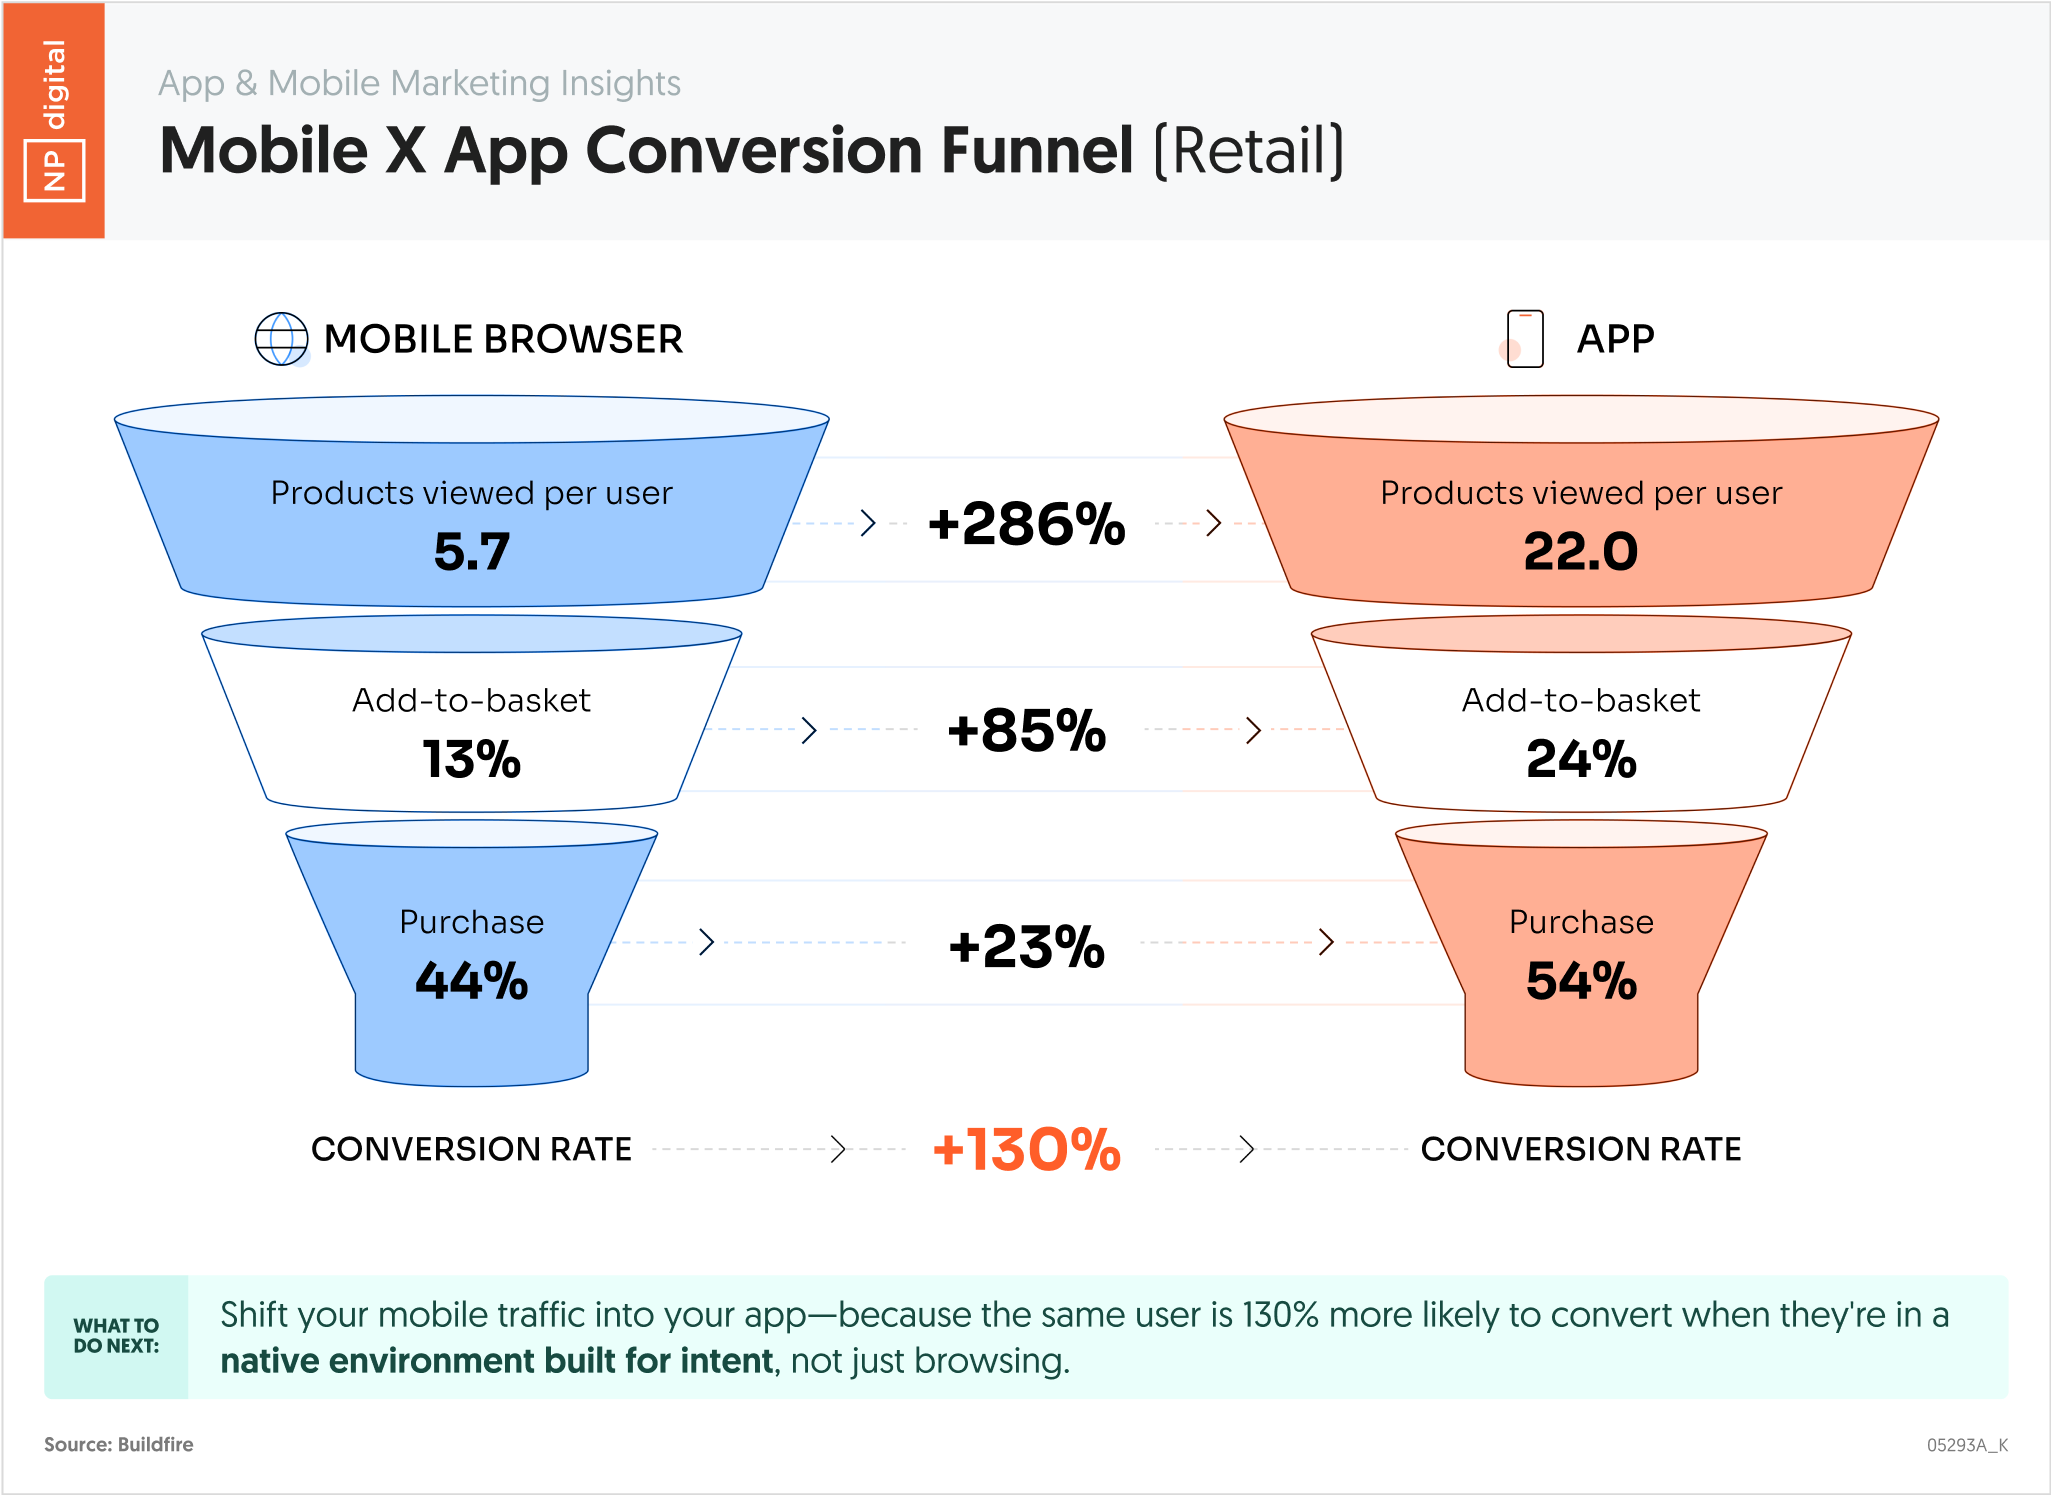
Understanding your app’s conversion funnel is critical if you want to increase installs and drive purchases. This chart shows where users drop off in retail mobile apps-and what you can do about it.
Essential Statistics
- 95% of users view product pages after app launch.
- Only 26% of users add products to cart.
- Just 12% move from cart to checkout.
- 7% complete a purchase.
- Drop-offs are highest between product view and add-to-cart.
Key Takeaways
- Most users explore but don’t convert, so CRO should focus on product pages.
- Cart abandonment remains a major hurdle for mobile apps.
- Checkout friction reduces final conversion significantly.
- Each stage requires tailored UX tweaks to reduce friction.
- Personalization and urgency messaging can improve cart-to-checkout rates.
Actionable Insights
- Simplify your add-to-cart process to reduce friction.
- Add progress indicators and trust signals in the checkout flow.
- Use exit intent pop-ups for cart abandoners.
- Optimize load speed of product pages to keep users engaged.
- Test time-based offers on checkout pages to increase urgency.
If you’re not fixing drop-offs at every stage of the funnel, you’re leaving revenue on the table. – Neil Patel